By Josh McConnell
Published
How we cut the cost of our self-hosted Grafana Mimir by 48% with a zonal chunks-cache and a move to Google's Axion arm64 CPUs.
Jump to section
Sanity is frequently a crucial part of our customers' stack as the content backend. They rely on our APIs to be able to create, update, operate, and distribute content. So putting a number to the uptime of our API endpoints is crucial. It's one of the ways we keep ourselves honest about how we do.
But that number has to come from somewhere, and for us it comes from Grafana Mimir, a time-series database that we host ourselves on Google Cloud Platform. We have every publicly exposed endpoint write metrics to it continuously, and every minute we query those metrics to check whether we're on track against our Service Level Objectives (SLOs).
As we offer more products and APIs as part of the platform, that means more time-series to store, more rules to evaluate against rolling windows, slower reads and writes, and a bandwidth bill that grows with it. That's the implied cost of scaling, of course. Often it's tempting to just scale up compute, call it operational cost and move on, but at Sanity we have a habit of optimising.
Here is the story of how we cut our Mimir costs almost in half with two changes (and how you might be able to do the same).
At Sanity we operate a self-hosted Grafana Mimir instance on GCP as a TSDB for our metrics, with a GCS bucket as an Object Storage backend.
We made the decision early on when building out our observability stack that the correct balance of redundancy to price was to run Mimir in a single GCP region, but across multiple zones. To protect against complete regional failure, we configured the Object Storage backend GCS bucket as multi-region, allowing us to redeploy the stateless(-ish) Mimir components to a different region if required.
To ensure that we're meeting our contractual obligations to our customers, we calculate SLI metrics for all publicly exposed endpoints, and alert when we're burning through an SLO’s error budget fast enough to breach it. That gives us time to act before we do; actual platform-level breaches are rare.
We started to find that as we added more and more endpoints, our Mimir performance degraded over time, specifically read, write and rule evaluation latency. To attempt to mitigate this, we would scale up hot components, which in turn would increase the cost of operation without actually addressing the underlying issue.
On top of this, we were also being billed for huge volumes of inter-zonal bandwidth, which grew every time we added a new endpoint. That bill isn't arbitrary: GCP’s list price puts intra-zone, inter-zone (same region), and inter-region traffic at a 0:1:2 ratio, so every byte that crosses a zone costs something and every byte that stays put is free.
Our optimisation approach was twofold.
Firstly, we'd observed massive price-performance improvements in other parts of our platform when migrating to GCP's C4A machines, which run on Axion, Google's own arm64 processors, and wanted to see if we could get the same improvements here.
Secondly, we needed to either reduce the inter-zonal bandwidth, or at the very least reduce the rate at which it scaled with new endpoints.
To reduce the amount of inter-zonal bandwidth, we started by considering what data was actually being transferred between each service to calculate our metrics. Below is a simplified illustration of our initial implementation (based on Mimir defaults), showing only the traffic flow downstream of our ruler-querier.
Initially we ran a single deployment of the chunks-cache, with 9 pods distributed randomly (but with an attempt to balance zonally via topology spread constraints) across all three zones in the europe-west1 region.
When querying in Mimir, recent data that has not yet been committed to long-term storage is queried from the ingesters currently processing that data. Older data is queried from store-gateways, which in turn check if the data is stored in the chunks-cache before falling through to the GCS bucket providing long-term storage.
Consider the data required to calculate an SLI, or performance against an SLO, for a given metric series over a given window:
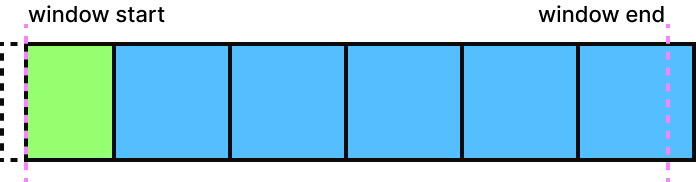
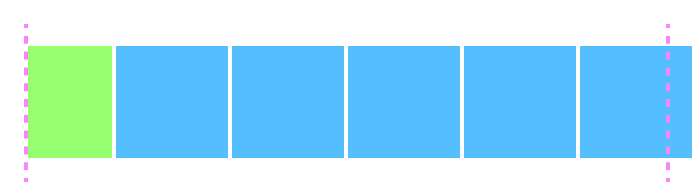
Here the green block is read from an ingester holding that data, with a 66% chance of requiring a read across a zonal boundary (assuming a truly random distribution of ruler-querier pods), and the blue blocks are read from a random store-gateway, again giving a 66% chance of requiring a read across a zonal boundary.
The store-gateway will in turn check if the block is cached in the chunks-cache, and if not, it will pull the block from GCS and store it in the chunks-cache. By default, the chunks-cache stores an object once, in whichever zone the receiving pod happens to be in, meaning that there's a 66% chance a cached object will be read across a zonal boundary.
Now consider the data required to calculate an SLI for the same metric series over the same window, some amount of time after the first:
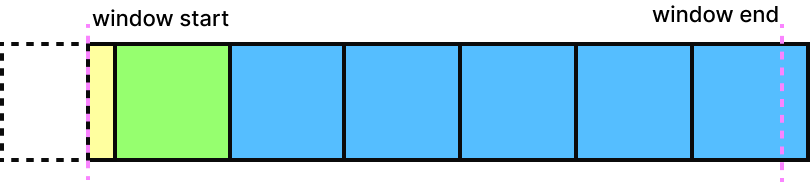
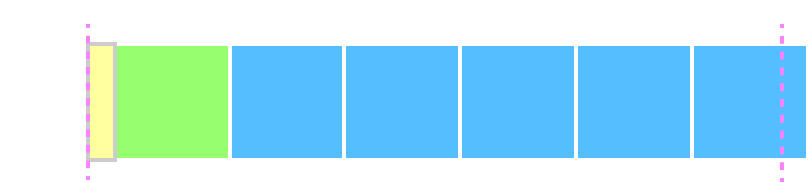
Here the green block has just reached the point where it's loaded from the store-gateway (rather than from the ingesters) and the yellow block is currently queried from the ingesters. The yellow block is read from an ingester holding that data, with the same 66% chance of a read being required across a zonal boundary as before.
The green block hasn't been cached before, so it must be fetched from GCS, and is then placed in the chunks-cache in a random zone. The blue blocks have been fetched before, and are in the chunks-cache in random zones. There's then a 66% chance that the store-gateway loads these blocks from a chunks-cache instance in a different zone.
Multiply this example by many time-series, with sliding windows evaluated every 60 seconds, and the volume of inter-zonal bandwidth between the store-gateway and the chunks-cache grows to very high (and expensive) levels.
To solve this, we moved the chunks-cache to a zonal deployment, as shown below.
In this deployment, any given object may be cached up to 3 times (once per zone). A given store-gateway will only check the chunks-cache in the same zone, and if it doesn't find the required object there, it will pull from GCS and cache.
Reconsidering the second SLI calculation: the behaviour for the yellow block is the same. For the green block, this time on first fetch it's stored in a chunks-cache instance in the same zone as the store-gateway. For the blue blocks, if they have been requested before in this zone they'll be pulled from the chunks-cache; if not, they'll be pulled from GCS and cached.
This approach requires 3x the number of requests to GCS (which are more expensive than cross-zonal requests to the chunks-cache). However, with an observed sustained cache hit rate of >99.9% on the chunks-cache, the number of requests falling through to GCS is minuscule, making this increase negligible.
Implementing this approach also requires 3x the compute to operate the chunks-cache (now one per zone, each of which needs a copy of each cached object).
After making this change we observed a 64% reduction in the inter-zonal bandwidth costs of operating Mimir.
Historically at Sanity we've relied heavily on E2 vCPUs for the majority of our workloads. We've found that for workloads with low CPU, high memory usage and relatively low network throughput, they provide an extremely competitive price-performance level.
As the CPU work carried out by a workload increases, we've observed E2 vCPUs scale badly and in unpredictable ways. Throughput can vary wildly depending on a range of factors. Across our platform, we now attempt to only use them for workloads which need a large amount of memory but have relatively low point-in-time throughput (workloads that spend a lot of time waiting for a large number of other things to calculate a small result).
For our initial implementation of Mimir, E2 vCPUs had been “good enough”, and the cheapest way to deliver what we needed. As Mimir scaled, we started seeing higher CPU usage and throughput, to the point where E2 vCPUs were starting to struggle.
We migrated the high-throughput components (ingester, distributor, ruler) to C4A vCPUs, maintaining a 1 E2 to 1 C4A mapping, and immediately observed a significant reduction in latencies across the three main areas we wanted to see improvement in:
- Read latency: average reduced from ~20ms to <10ms
- Write latency: average reduced from ~35ms to 18ms, and stabilised
- Rule evaluation latency: average reduced from 380 to 800ms down to 140 to 200ms
We then had a new baseline for the latencies that we could target as we scaled down the three components we had migrated to C4A vCPUs. Once we reached the point where any further reduction would have a negative impact on any of the three latencies, we stopped and evaluated the savings. We'd reduced the total number of vCPUs in use by ~50%, gone from a 100%:0% E2:C4A split to 20%:80%, and reduced the total cost of vCPU + RAM by 30%.
The effort invested here was well worth it. The total cost of operating our Mimir instance dropped by 48%, while performance and scalability improved. What we'd tell anyone running a similar stack:
- C4A Axion CPUs continue to be amazing. Price-performance is unrivaled for the majority of use cases.
- E2 CPUs still have their place, but their usage should be considered carefully. They offer good price-performance for high-memory, low-throughput applications.
- Migrating stateful applications across cloud provider persistent disk generations can be a complicating factor (E2 CPUs support only PD, C4A only Hyperdisk). We could have saved time and effort by initially using a CPU generation that supported a more modern disk family.
- Running in multiple zones is necessary for redundancy, but gets expensive when large amounts of data are transferred across them. Scaling requires careful consideration of zonal boundaries.
More from Engineering