Observability definition
Observability is the ability to understand what a system is doing from the outside, using the signals it emits, such as logs, metrics, traces, and events. A system is observable when you can answer new questions about its behavior, including why something failed, without adding new instrumentation first.
Observability is how you know an automated system is still working, and why it stopped when it isn't. It comes from the signals a system emits while it runs: logs of what happened, metrics of how much and how fast, traces of how a request moved between services, and events marking state changes. In Sanity, automation runs against content whose changes are recorded as versioned document events, so a workflow that silently stops producing output can be traced back to the document and revision that triggered it.
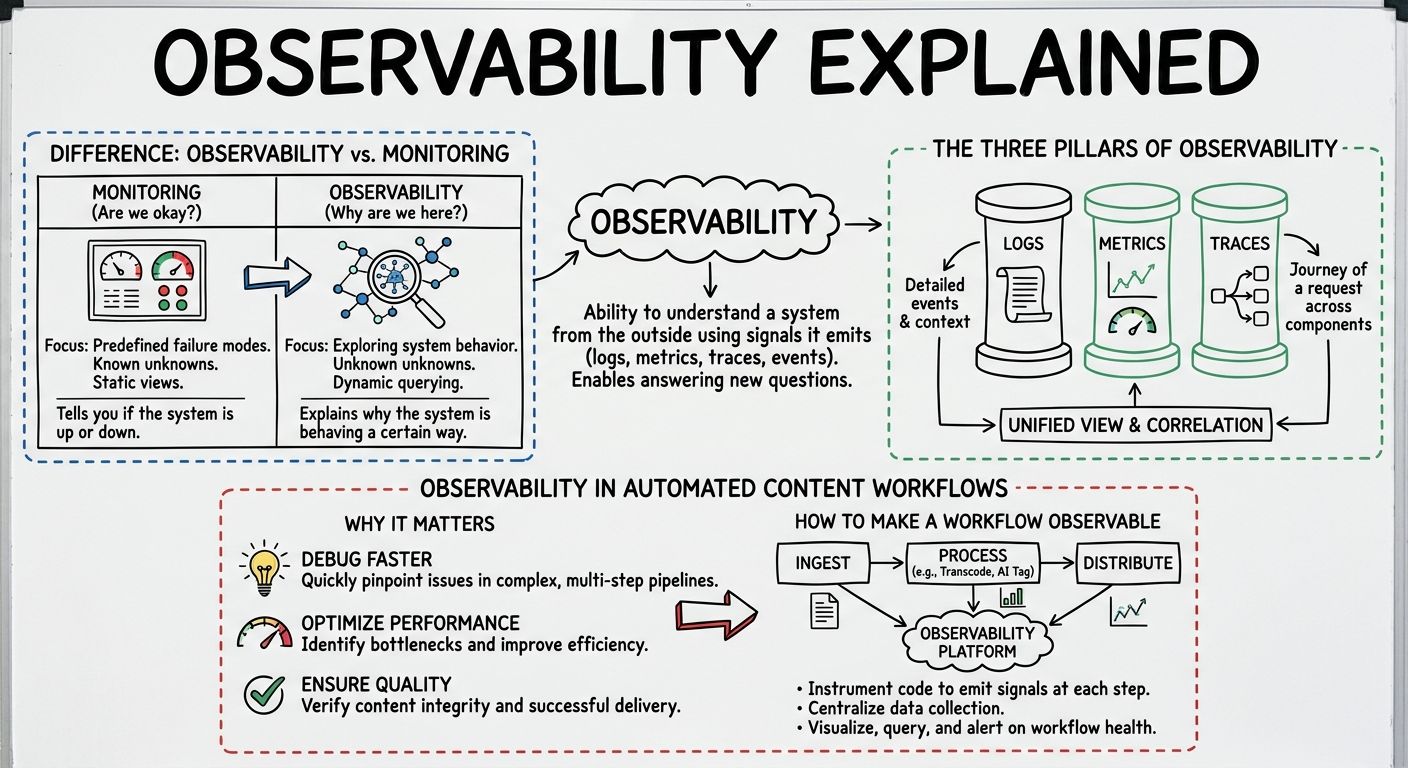
Monitoring tells you whether the conditions you predicted have been met, but observability helps you investigate conditions you did not predict. A monitor is a question you wrote in advance: is the publish queue longer than 500 items, did the nightly sync return a non-200 status, is latency above two seconds. Observability is the property that lets you ask a new question at 2am, such as why only Spanish-language product pages stopped translating, and get an answer from data the system is already emitting.
The two are complementary. Monitoring is usually what pages someone. Observability is what they use once they are awake. A workflow with good monitoring and poor observability produces alerts nobody can act on, because the alert says something broke without saying where or for which records.
A practical test for observability is whether you had to ship new code to answer the question. If diagnosing an incident required adding a log line, redeploying, and waiting for the problem to happen again, the system was not observable for that class of question.
The three pillars of observability are logs, metrics, and traces, a framing popularized by the book Distributed Systems Observability by Cindy Sridharan and now standard vocabulary across the field.
Logs are timestamped records of discrete things that happened, such as "translation job 4412 failed: upstream timeout". Logs carry the most detail and are a common starting point for a root-cause investigation. Metrics are numeric measurements aggregated over time, such as jobs completed per hour or error rate per endpoint. Metrics are cheap to store and good at showing that something changed, but poor at explaining what. Traces follow one unit of work as it crosses service boundaries, recording how long each hop took, which is how you find the slow step in a chain of six services.
Many practitioners treat the three pillars as a starting taxonomy, not a complete model, since the pillars describe data types instead of the questions people need answered. A useful addition for content workflows is the event: a structured record that something meaningful changed, such as a document being published or a schema field being renamed, which gives every downstream signal something to correlate against.
Observability matters for automated content workflows because automation fails quietly. A human publishing a page notices when the page does not appear. A scheduled job that generates product descriptions, translates them into nine locales, and pushes them to a search index can stop producing output for days without anyone noticing, especially if the failure is partial and only affects one locale or one product category.
The risk grows as workflows chain together. When an AI step summarizes content, a validation step checks it, and a publish step ships it, each stage can succeed technically but still produce the wrong result. Instrumenting only "did the job exit 0" catches crashes and misses everything else. Instrumenting the content outcome, such as how many documents entered a stage versus how many left it with the expected fields populated, catches the quieter failures.
In our experience with content operations, the most useful single signal is a per-document audit trail: for any given piece of content, who or what changed it, when, and as part of which automated run. That turns a vague report that "the translations look wrong" into a specific revision you can inspect.
Making a content workflow observable starts with deciding what questions you need to answer, then emitting the data that answers them. A workable sequence looks like this.
First, define the unit of work. For content automation this is usually a single document or a single run over a set of documents, and everything you emit should carry that identifier. Second, emit a start and end event for every stage, each including the unit identifier, a status, and a duration. Third, record inputs and outputs, not just status codes: how many documents a stage received and how many it emitted with the expected result. A stage that receives 900 documents and emits 812 successfully is a partial failure that a green checkmark would hide.
Fourth, propagate a correlation identifier so a single run can be reconstructed across every service it touches. Fifth, set thresholds on the outcome, alerting on "fewer than 95 percent of documents completed translation" rather than "the job returned an error". Sixth, keep history long enough to compare against, since "is this slow?" is only answerable against a baseline. Finally, make the data reachable by the people who own the content, not only the engineers who own the pipeline.
OpenTelemetry is the vendor-neutral standard for generating and exporting observability data, and it is how most teams avoid rewriting their instrumentation every time they change monitoring tools. It is a project of the Cloud Native Computing Foundation, formed from the merger of the earlier OpenTracing and OpenCensus projects, and it defines both the data formats and the SDKs for emitting traces, metrics, and logs.
The practical benefit is decoupling. Your application code emits signals in the OpenTelemetry format, a collector receives them, and the collector routes them to whichever backend you use for storage and querying. Swapping that backend becomes a configuration change rather than an instrumentation project.
For content workflows, the same principle applies at a smaller scale even if you never adopt OpenTelemetry itself: emit structured signals with stable field names, keep them separate from the tool that displays them, and you retain the ability to change tools without losing history.
Discover More with Sanity
Now that you've learned about observability, why not start exploring what Sanity has to offer? Dive into our platform and see how it can support your content needs.
Last updated: