Grade your ad before you spend a dollar on it
- Score new creative against your proven winners before a dollar goes out, not after the campaign wraps
- Catch the signals dashboards miss. Like frequency burnout, uneven spend concentration, and the variant that never got off the ground
- A pre-launch grading framework that keeps working as campaigns run across Meta, LinkedIn, and Reddit

Bree Hall
Senior Developer Content Lead

Richard Lawrence
A data scientist and developer, with an interest in marketing and search.
Published:
For the Head of Growth
You already know the shape of this. A designer hands over an ad, someone launches it, and the weekly report rolls up to the campaign, so the winning creative and the fatigued one blur into a single number. The only honest answer to "was that ad any good?" arrives after you've paid to find out.
What our own paid program showed. We ran the numbers on Sanity's own Meta account before writing any of this down, and two of them tell the story. A handful of creatives, about one in ten, ate 80% of the impressions. And the best-performing ads earned close to three times the click-through of the weakest. Some of your creative is far better than the rest, and today you find out which is too late to move the budget behind it. That gap is the size of the opportunity, measured on our own account. We're running an A/B holdout to prove it out next.
What changes is the order of events. You test a creative against your own proven winners before it goes live, watch every channel in one place once it does, and get a daily read on which ad, by name, is worth more money. Less budget spent learning what a five-second look could have told you.
The rest of this is for whoever builds it. Send them the sections below.
The structural shift
Most teams treat creative feedback as reporting. You spend, you measure, you review. The feedback always trails the money.
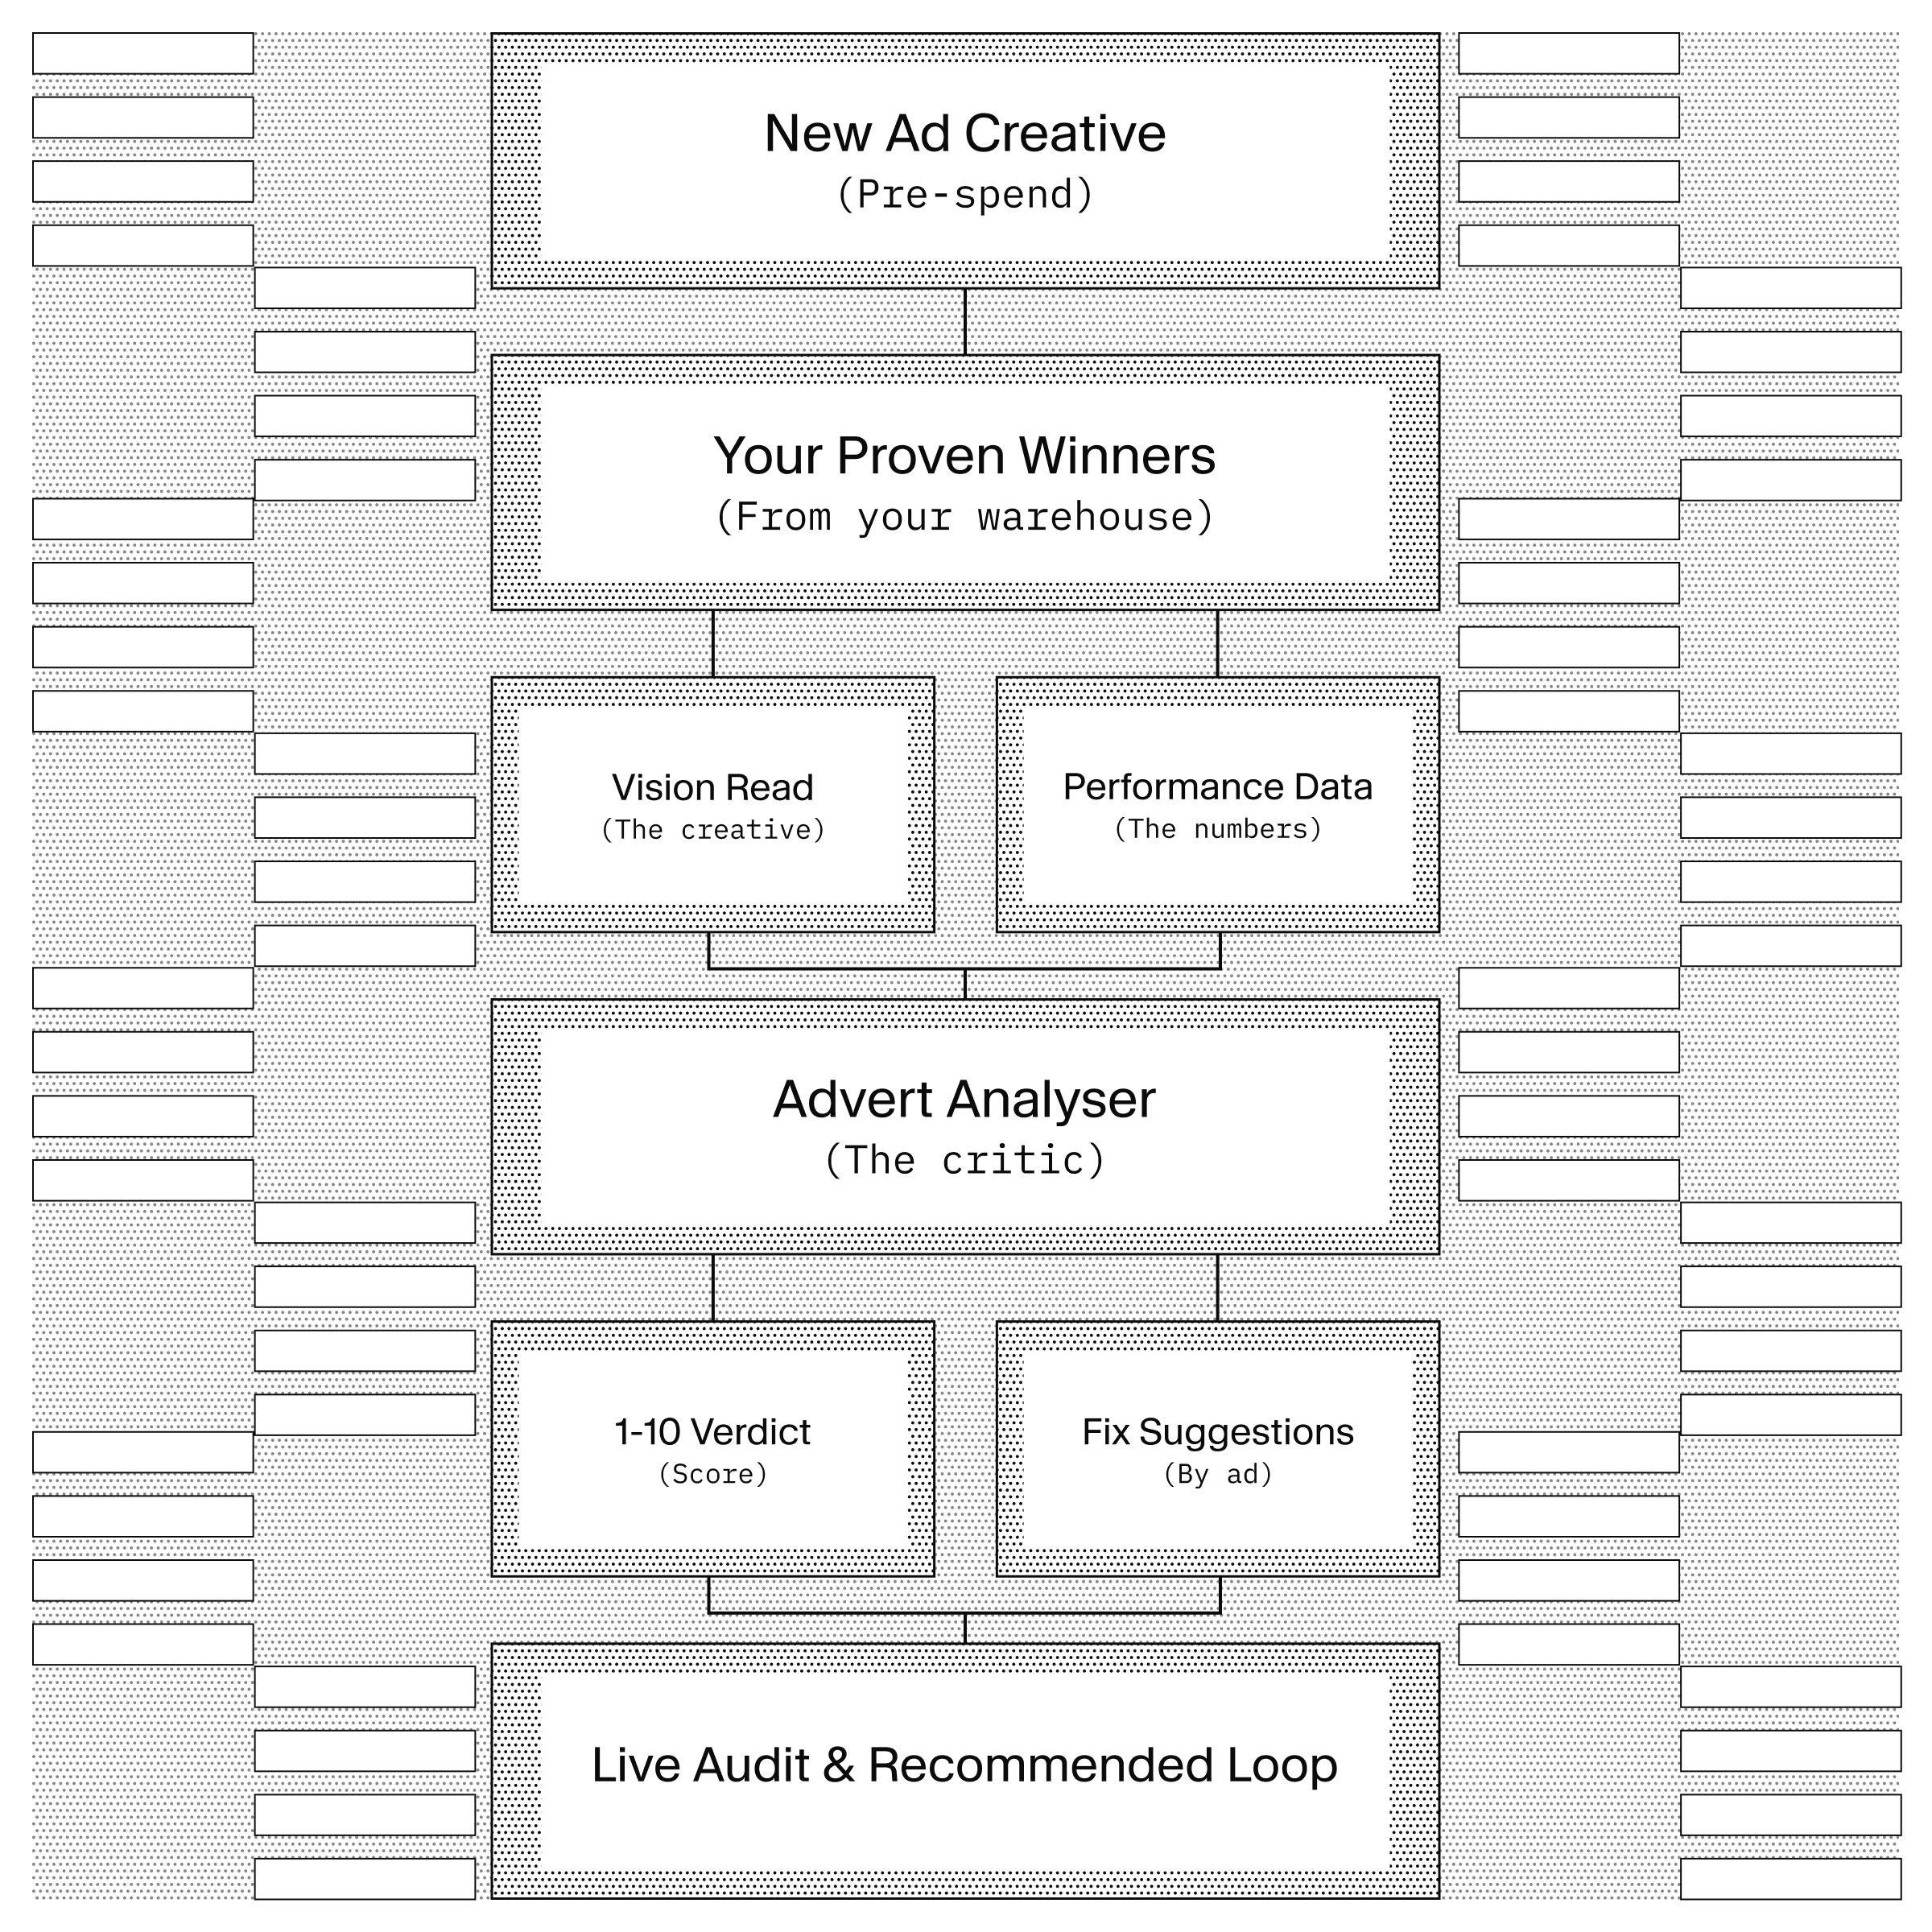
Sanity treats the ad as content, and the same operating system that produces it also audits it. The reference point isn't a generic best-practices checklist. It's your own historical winners, sitting in your own warehouse, scored by an agent that has actually looked at them. That one move flips the feedback loop from post-mortem to pre-flight, and it runs continuously after launch instead of once a week in a slide.
Three things make that work: a reference set drawn from real spend, a fixed rubric so every verdict is comparable, and a Content Agent that reads the image, not just the metrics.
Your winners are the benchmark
The first thing the agent does is pull the top-performing creatives for the exact channel and objective you're testing, ranked by real spend and click-through, from the warehouse where your ad data already lives.
// The agent's first move: pull YOUR proven winners, not a generic benchmark.
comparable_paid_ads_creatives({
  channel: "meta",        // meta | linkedin | google_ads | reddit
  objective: "leadgen",   // leadgen (must have real leads) | traffic
  daysBack: 90,
})
// → [{ ad_id, headline, body, image_url, impressions, clicks, spend, ctr, leads, mqls }, ...]
For lead-gen the reference set only includes ads that produced actual leads, so a new creative is measured against results, not clickbait. A brand-new channel with no history is the honest limitation here: there's nothing to benchmark against yet, so the agent widens the window or borrows a sibling channel and says so in its verdict rather than inventing a baseline.
A rubric, not a vibe
Every test returns the same structured verdict. Six dimensions, a one-to-ten score on each, a plain verdict, and concrete suggestions that point at a specific reference ad. Because the output shape is fixed, the dashboard can score and track it, and two people testing two ads are speaking the same language.
{
  "overall_rating": 7,
  "verdict": "likely_similar",
  "category_scores": {
    "hook": 6, "copy": 8, "visual": 5,
    "cta": 7, "channel_fit": 8, "objective_fit": 6
  },
  "specific_suggestions": [
    "Move the offer into the first line of body copy. ad_id 238x9 leads with it and holds a 1.4% CTR."
  ],
  "top_references": [{ "ad_id": "238x9", "why_it_works": "One product, one claim, offer above the fold." }]
}
The agent is barred from generic feedback like "nice colors" and from inventing numbers about your upload. Every point it makes cites a winner by ad_id. When a creative is weak, it says so, because you're asking before you spend, and a flattering score costs you money.
The agent actually sees the creative
A metrics-only tool can't tell you why an ad works. This tool looks at both the uploaded image and each historical winner, so its able to judge the creative as well, not just the outcomes.
// Vision over the upload AND the reference ads.
describe_images({
  images: [upload, ...references.map((r) => r.image_url)],
  questions: [
    "What is the dominant visual element?",
    "What in-image text is present, verbatim?",
    "Is there a visible CTA, and what does it say?",
  ],
})
That's the difference between "your CTA is weak" and "your CTA is buried in the bottom corner. The three top LinkedIn winners put it on a button in the top third."
One view across every channel
Once ads are live, Meta, LinkedIn, Google, and Reddit report in one Content Lake-backed dashboard instead of four browser tabs, and a daily digest posts to Slack with the one thing the platform reports never surface cleanly: which ad, by name, is winning and which is quietly eating your impressions. That last part came straight from our own performance marketer, who asked the reporting bot to stop grouping by campaign and start naming the ad.
Where this goes next
The loop closes with a scheduled Function that audits live performance on its own and recommends what to do about it. Today that step is a person pasting numbers into a chat window and reading back the advice. The next version reads the same tables the dashboard uses, flags the ads eating a disproportionate share of impressions and the ones fatiguing your audience, and posts the actions to Slack.
// Ahead of product: a scheduled Function auditing live performance nightly.
// Reads the same warehouse tables the dashboard uses; posts actions, not just numbers.
export async function auditNightly() {
  const ads = await queryWarehouse(/* impression share, frequency, CTR by ad_name */)
  const actions = flagConcentrationAndFatigue(ads) // pause / scale / frequency-cap
  await postToSlack("#paid-ads", formatRecommendations(actions))
}
That's the second reason to build this now. The first is you stop paying to learn what a five-second look could have told you.
Try it yourself
You don't need a starter to test this. Take the rubric from above, point it at your own ad account export, and run it through the model of your choice: pull your top performers, score a new creative against them on the same six dimensions, and see whether the verdict holds against real spend.
If it holds, you graded an ad before spending on it. If it doesn't, you learned where your winners actually win. Either way, it's your data and your model, in an afternoon.
Building it and want help, or want to compare notes? Join our Discord, where people working on the same problem trade rubrics and share what's working.