

article
Automate your content audits with AI
Your analytics data and your editorial workflow live in separate tools, and that gap is where a trending post goes unnoticed for three days. This guide shows you how to bring performance signals directly into Sanity Studio, so editors can see what’s working, what’s stale, and what needs attention without ever leaving the place they write.
Automated nightly reviews surface underperforming posts before they become a problem. Editors never leave the document.

Jarod Reyes
Head of Developer Experience & Community at Sanity
Published:


A digital newsroom publishes fifteen articles a day across five sections. When one starts trending, the editor who notices has to go find it in the CMS, open it, and decide what to do. Nothing connects the insight to the content.
The developer team, meanwhile, has built three separate front-end analytics integrations over two years: a trending sidebar, a most-read rail, a newsletter digest. Each pulls from the analytics API on its own schedule and none are consistent. A
The starter closes the gap by treating analytics signal as content: derived tiers and states written into Sanity as companion documents. Editors see performance context on the article they are editing. Developers build content-intelligence rails as GROQ queries against the same dataset. Content Agent triages the catalog overnight and stages improvements in a draft for editorial review.
Sanity is not the analytics platform. The analytics platform stays authoritative for raw data. This is about the layer that turns that signal into editorial action.
Analytics data without a path to action is expensive. Your editorial team is capable of hunting down the data. What they lack is a workflow that connects the number on a dashboard to the article on the page. The editor sees the tier on the document they already have open, so the decision happens there instead of in a spreadsheet next quarter.
The engineering investment is one-time and scoped. The sync runs unattended once deployed; expect to touch it when your analytics provider changes its API. A developer builds a nightly sync that reads from your analytics platform, computes performance tiers relative to your catalog, and writes companion documents into Sanity. It runs as a Sanity Scheduled Function, so there is no separate cron infrastructure to maintain.
Production customers are already running this pattern. BODi runs a behavioral analytics loop in production: watch history feeds AWS Personalize, which drives trending recommendations served through Sanity content.
Where the value shows up. One CTO reported 30% organic traffic growth attributed to tracking better analytics alongside their content operations.
The naive way to give editors performance context is to add analytics fields directly to the article document: views30d, sessions7d, bounceRate. This runs into two problems immediately.
The first is that every nightly sync write updates article._updatedAt. That field becomes useless as a signal that a human edited the article.
The second is that storing raw metrics in Sanity creates a secondary store that duplicates the analytics platform without staying in sync with it. Editors then risk making decisions from Sanity's stale copy rather than the authoritative source.
Write analytics signal into a companion document type (articlePerformance) instead of onto the article. Store only derived signal (tiers, trend direction, lifecycle state, catalog percentile) rather than raw counts. The analytics platform stays authoritative. article._updatedAt stays purely editorial. _type to distinguish sync from editorial writes.
Two document types do most of the work. The article document is the editorial record, with two fields added for the loop: editorialPriority (the editor's response to signal) and agentReview (the state machine that Content Agent operates against).
// studio/schemaTypes/documents/article.ts (relevant additions)
defineField({
  name: 'editorialPriority',
  type: 'string',
  options: {
    list: ['needs_update', 'promote', 'archive', 'monitor'],
    layout: 'radio'
  }
}),
defineField({
  name: 'agentReview',
  type: 'object',
  fields: [
    {
      name: 'status',
      type: 'string',
      options: { list: ['idle', 'queued', 'in_progress', 'staged', 'approved', 'dismissed'] },
      initialValue: 'idle'
    },
    { name: 'agentNotes', type: 'text' },
    { name: 'releaseId', type: 'string' },
    { name: 'reviewedAt', type: 'datetime' }
  ]
})
The articlePerformance document is a companion, synced nightly, never edited by humans. It joins to the article via a reference.
// studio/schemaTypes/documents/articlePerformance.ts
defineType({
  name: 'articlePerformance',
  type: 'document',
  fields: [
    defineField({ name: 'article', type: 'reference', to: [{ type: 'article' }] }),
    defineField({
      name: 'performanceTier',
      type: 'string',
      options: { list: ['trending', 'stable', 'stale', 'new'] }
    }),
    defineField({
      name: 'trendDirection',
      type: 'string',
      options: { list: ['rising', 'flat', 'falling'] }
    }),
    defineField({
      name: 'lifecycleState',
      type: 'string',
      options: { list: ['active', 'declining', 'dormant', 'archive_candidate'] }
    }),
    defineField({
      name: 'topReferrer',
      type: 'string',
      options: { list: ['organic', 'social', 'direct', 'referral', 'email'] }
    }),
    defineField({ name: 'catalogPercentile', type: 'number' }),
    defineField({ name: 'syncedAt', type: 'datetime' })
  ]
})
A single analyticsContext singleton holds catalog-level counts (total articles, tier distribution) so Content Agent can query catalog context cheaply without scanning every companion document.
The sync runs nightly. It reads from the analytics platform, computes tiers relative to the whole catalog, and upserts articlePerformance documents.
The classification is catalog-relative rather than absolute. "Stale" means underperforming its peers, not below some arbitrary "target" from a HubSpot article. Percentiles hold up across section sizes, though very small catalogs (under ~50 articles) will give you noisy tiers.
// packages/@starter/analytics-sync/src/classify.ts (excerpt)
export function classifyArticle(article, distribution) {
  const percentile = percentileOf(article.sessions, distribution.sessions)

  if (percentile >= 90) return { tier: 'trending', lifecycleState: 'active' }
  if (percentile <= 25 && article.ageInDays > 90) {
    return { tier: 'stale', lifecycleState: 'declining' }
  }
  if (article.ageInDays < 14) return { tier: 'new', lifecycleState: 'active' }
  return { tier: 'stable', lifecycleState: 'active' }
}
The sync runs as a Sanity Scheduled Function, registered in the blueprint and executed on Sanity's Functions runtime. That removes the need for an external cron or a separate
// functions/analytics-sync/index.ts
import { defineScheduledFunction } from '@sanity/functions/blueprints'
import { runSync } from '@starter/analytics-sync'

export default defineScheduledFunction({
  name: 'analytics-sync',
  event: { expression: 'every day at 3am' },
  timezone: 'America/New_York',
  handler: async ({ context }) => runSync({ context })
})
The starter also ships a standalone scripts/analytics-sync.ts for teams that need to run the same code from an external scheduler (GitHub Actions, Vercel Cron, or a self-hosted runner). Both entry points call the same runSync function from @starter/analytics-sync, so the code path is identical.
The analytics platform is pluggable. The starter includes a fixture provider (so the demo runs with no credentials) and a GA4 skeleton. Additional providers (Amplitude, Heap, PostHog) implement the same interface.
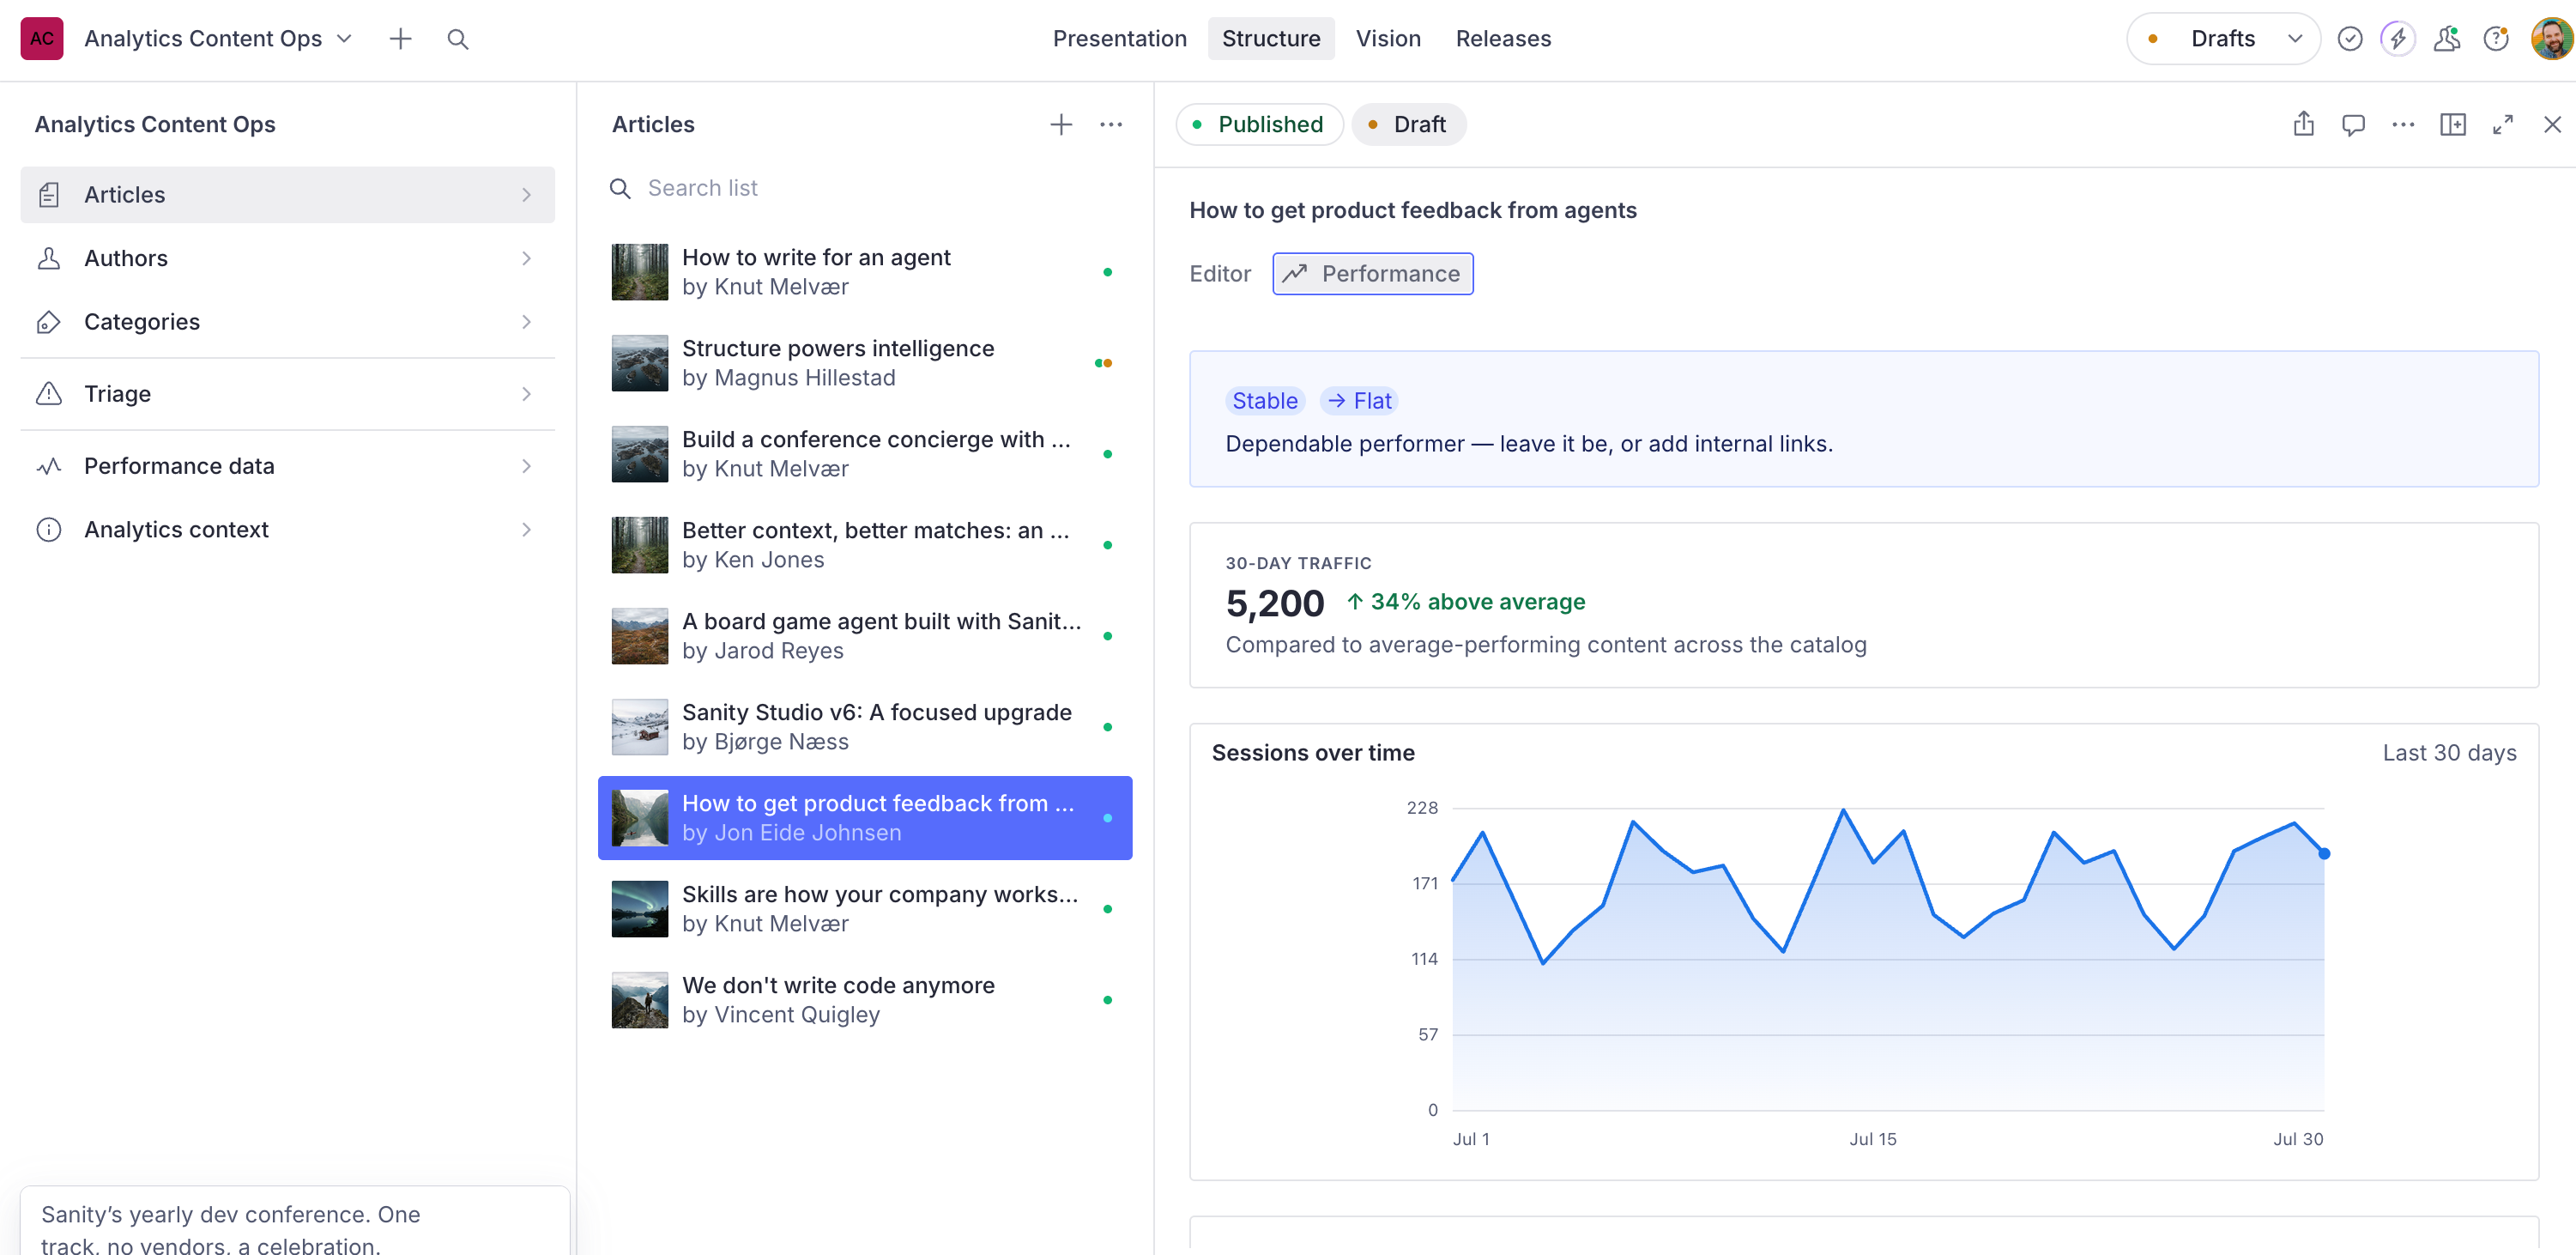
Editors see everything in Studio without leaving it.
The document badge shows performance tier next to the article title in the header: trending (green), stale (gray), archive_candidate (red). Stable articles show no badge, which cuts noise.
A read-only Performance panel opens as a second view on every article. It fetches the companion document via useDocumentStore().listenQuery(), so it updates live when the sync writes new signal. The panel shows tier, trend direction, lifecycle state, catalog percentile, last sync time, and a one-line editorial cue drawn from a lookup table of tier and lifecycle combinations.
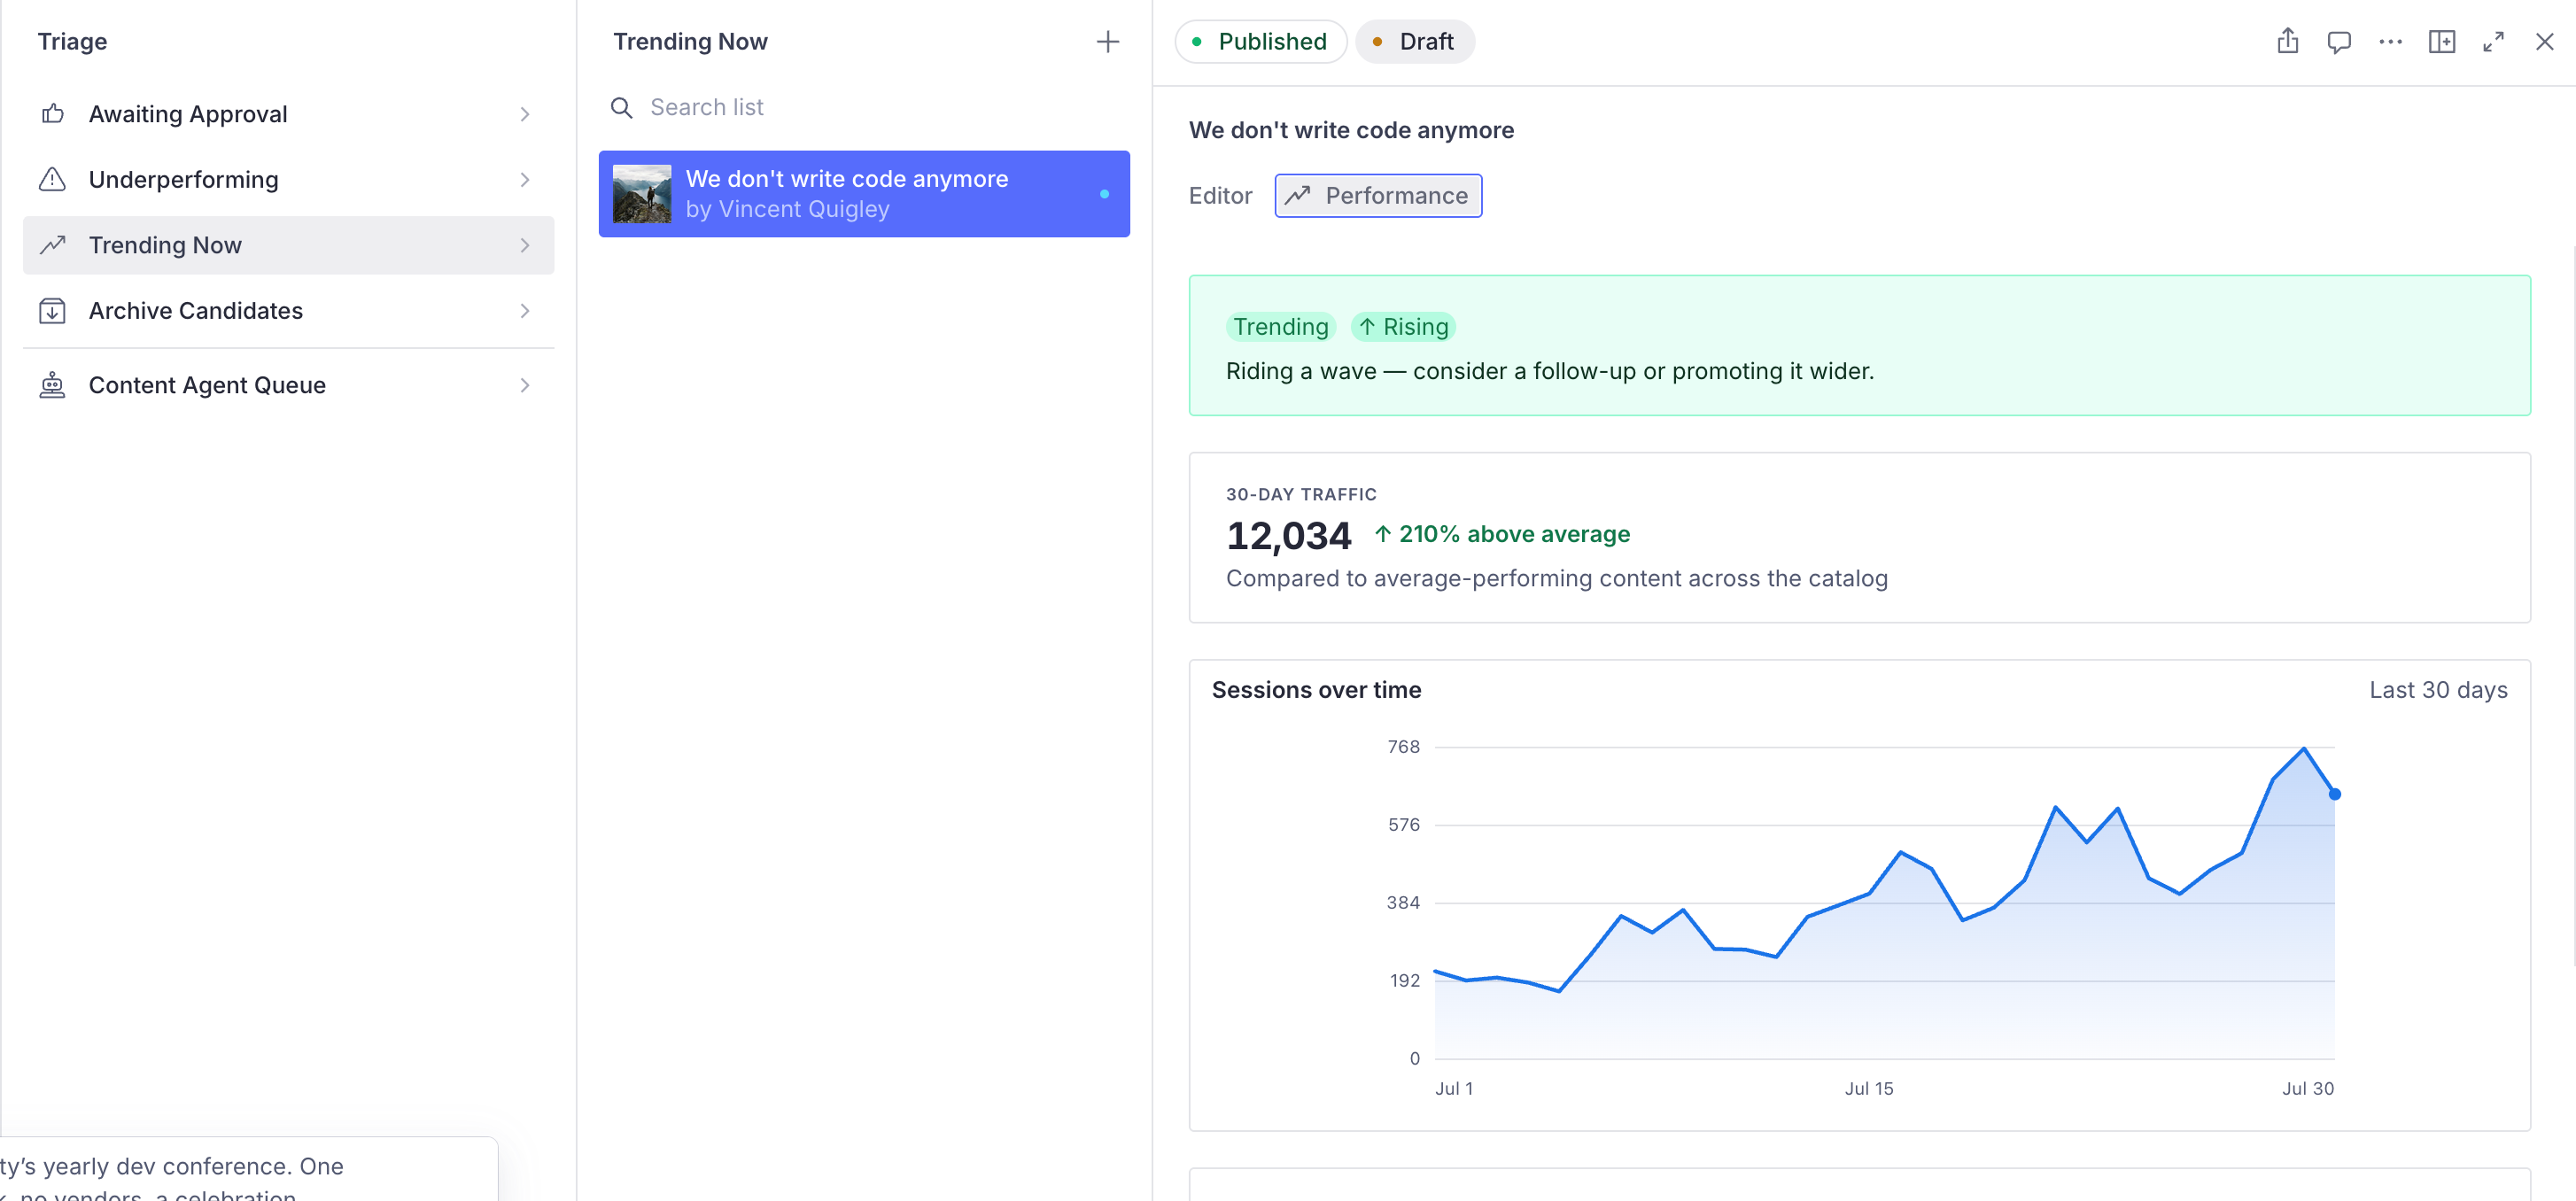
Structure Builder triage views group articles by state.
// studio/structure.ts (relevant excerpt)
S.listItem()
  .title('Needs Attention')
  .child(
    S.documentList()
      .title('Stale + declining, this week')
      .filter(
        `_type == "articlePerformance" &&
         performanceTier in ["stale"] &&
         lifecycleState == "declining" &&
         syncedAt > now() - 60*60*24*7`
      )
  )
Views ship for Needs Attention, Trending Now, Archive Candidates, and the Content Agent Queue. Section editors triage from these views instead of from a separate spreadsheet or dashboard.
Once the companion documents exist, the front-end content-intelligence features become GROQ queries against the same dataset.
// Trending articles rail
*[_type == "articlePerformance" && performanceTier == "trending"]
  | order(catalogPercentile desc)
  [0..9]
  {
    "article": article->{ title, slug, mainImage, publishedAt }
  }
// Most-read this week, joined with article body
*[_type == "articlePerformance" && trendDirection == "rising"]
| order(catalogPercentile desc)
[0..4]
{
"article": article->{
title,
slug,
"excerpt": pt::text(body)[0..200]
}
}When the nightly sync updates tiers, every surface that reads from these queries reflects the new state on the next request. The three separate front-end analytics integrations from the newsroom scenario become one sync job and a set of GROQ queries against the same dataset.
A second scheduled Function runs 30 minutes after the sync. It loads articles where agentReview.status == "queued" (newly stale, marked by the sync), reads each article's content plus its performance context from the companion document, and calls the Content Agent API.
For each article, the agent writes reasoning and three specific improvement opportunities into agentReview.agentNotes. It stages improvements to title, seoTitle, seoDescription, and the article's intro. All writes go to the draft, not the published document. The agent marks each article staged.
The agent routes the improvement angle by top referrer. For articles that get most traffic from organic search, it prioritizes SEO metadata. For social-driven articles, it focuses on hooks and shareability. Email-driven articles get narrative depth and CTA revisions, and direct-traffic articles get updated facts and internal links.
// functions/agent-triage/index.ts (excerpt)
import { runAgentTriage } from '@starter/analytics-sync/agent'

export const handler = async ({ context }) => {
  const queued = await context.client.fetch(
    `*[_type == "article" && agentReview.status == "queued"][0...20]`
  )

  for (const article of queued) {
    const performance = await fetchPerformance(context.client, article._id)
    await runAgentTriage({ client: context.client, article, performance })
  }
}
The ops lead reviews the resulting Content Release in the morning. They approve, dismiss, or refine in the Dashboard Content Agent. Nothing publishes without a human action.
The pattern includes three safety layers. The GROQ filter scopes the agent to agentReview.status in ["queued"], so the agent cannot wander the catalog. The
Clone it and run the sync once against [the seed data it ships with]. Open any article in Studio, and its performance tier is right there on the document you're editing. Run the trending query and the rail populates from the same dataset
pnpm create sanity@latest --template sanity-labs/starters/analytics-content-ops --package-manager pnpm
cd your-project
pnpm install
# The starter does NOT cascade a single root .env into every workspace.
# Copy all three:
cp studio/.env.example studio/.env
cp frontend/.env.example frontend/.env
cp .env.example .env
# Fill in the same project ID and dataset in each
pnpm bootstrap
pnpm dev
pnpm bootstrap deploys the schema, generates types, and seeds the demo. The default ANALYTICS_PROVIDER=fixture ships deterministic demo metrics so everything runs with no analytics credentials. The demo is styled as Friluft Media, a Norwegian outdoor publication, using real articles from the Sanity blog as demo content.
Studio runs at localhost:3333. The media site runs at localhost:3000. Open an article in Studio, click the Performance tab, and watch the panel populate from the companion document. Change ANALYTICS_PROVIDER=ga4 and implement the GA4 provider skeleton at packages/@starter/analytics-sync/src/providers/ga4.ts to point it at real data.
The starter is at sanity-labs/starters/analytics-content-ops.
Let Content Agent triage overnight, then open the draft it stages and approve one fix. That's the newsroom scene from the top of this article, running on your own catalog.
If you deploy a version of this automatic newsroom analytics send us an email at devrel@sanity.io and we’ll feature your build on our showcase.


