Visualize your content graph
This plugin from our recent hackathon lets you see datasets as connected clouds of information

Kapehe
Developer Community Enablement Manager at Sanity

Alexander Staubo
Alex is a senior backend developer at Sanity.io.
Published
What is Graph View and where did it come from?
Recently Sanity had a distributed, virtual all-hands. As part of this, we held an internal hackathon where everyone came up with ideas for short projects that could be completed in a week. Graph View is the first of these projects we are releasing. The team behind it is Alexander Staubo, Marius Lundgård, Christian Flaaten, Bryan Robinson, Ørjan Ommundsen, and Will Luna.
When using Sanity, the collection of documents can grow quickly. Good modeling and organization requires that we understand how our data is connected. Without a holistic way to visualize how our dataset is shaped, there may be a lot of connections that go unnoticed, resulting in structures and decisions made with less intentionality than we like.
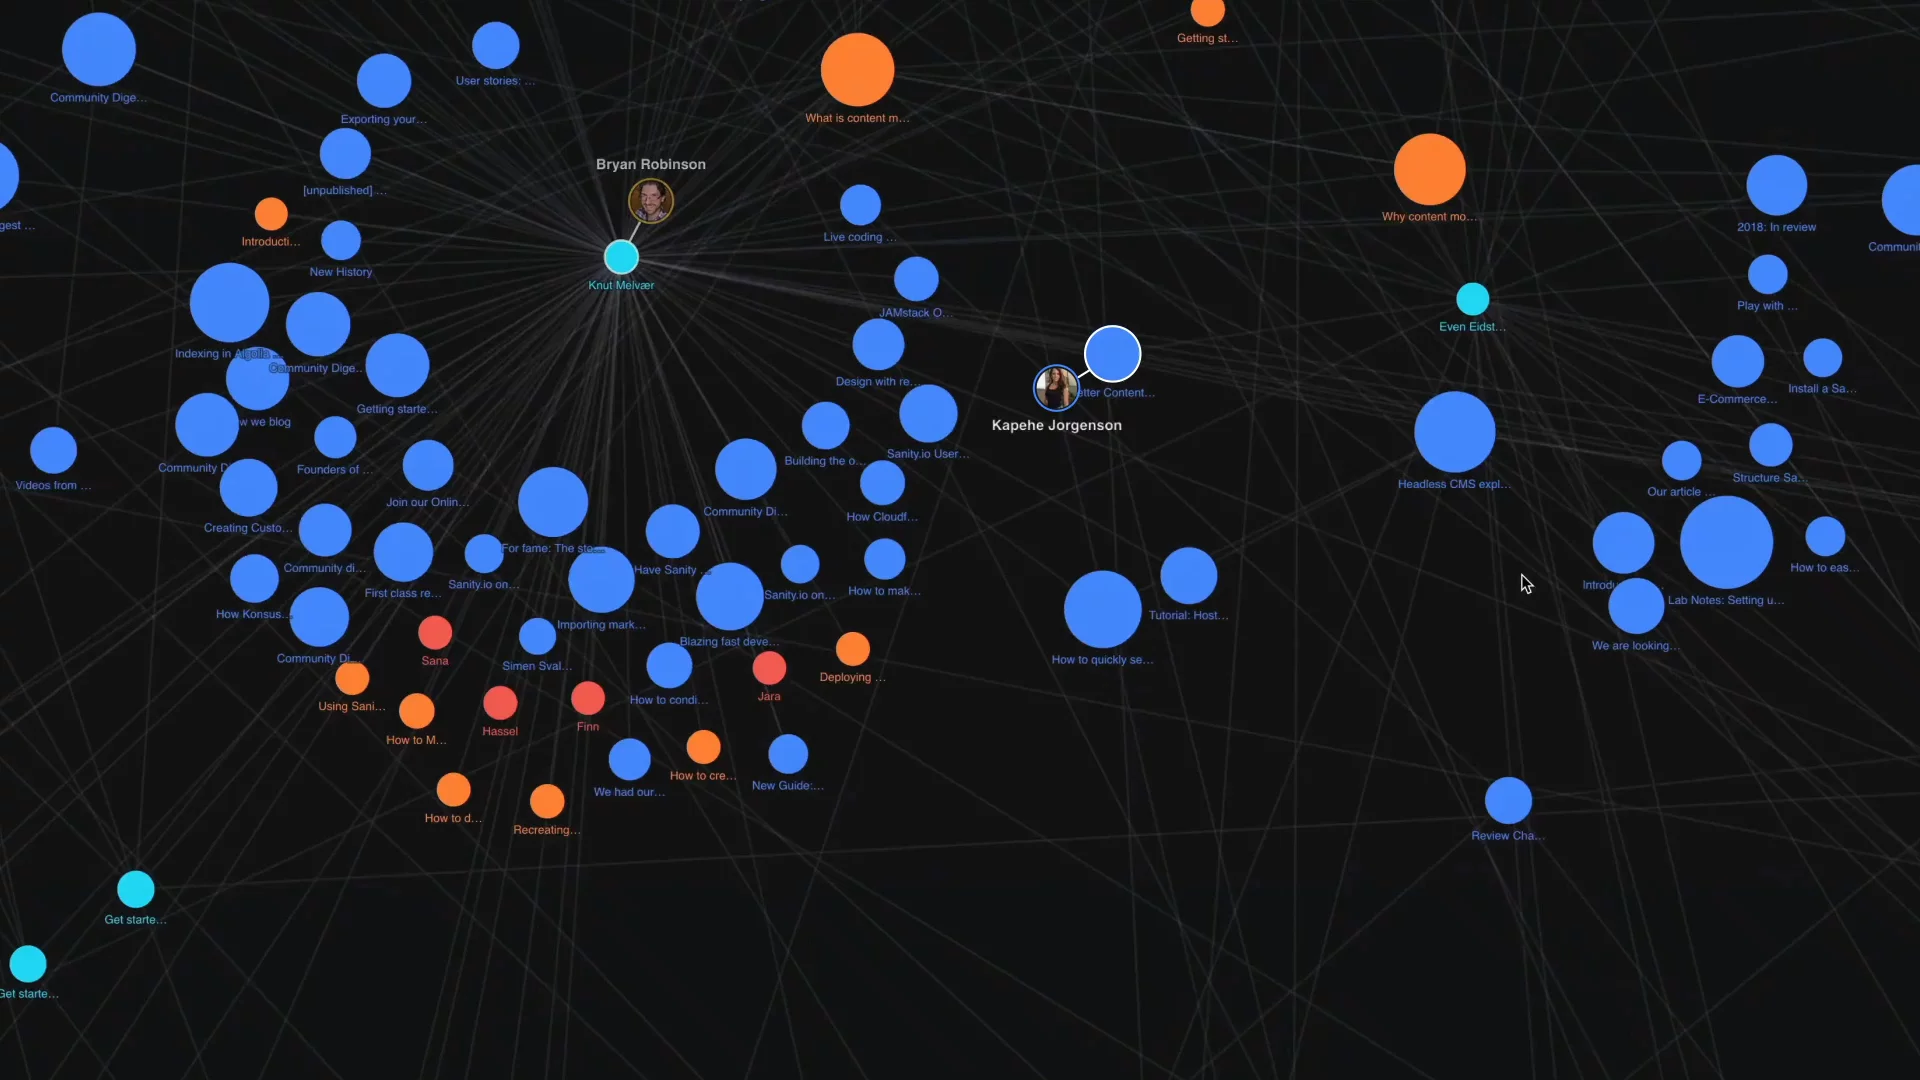
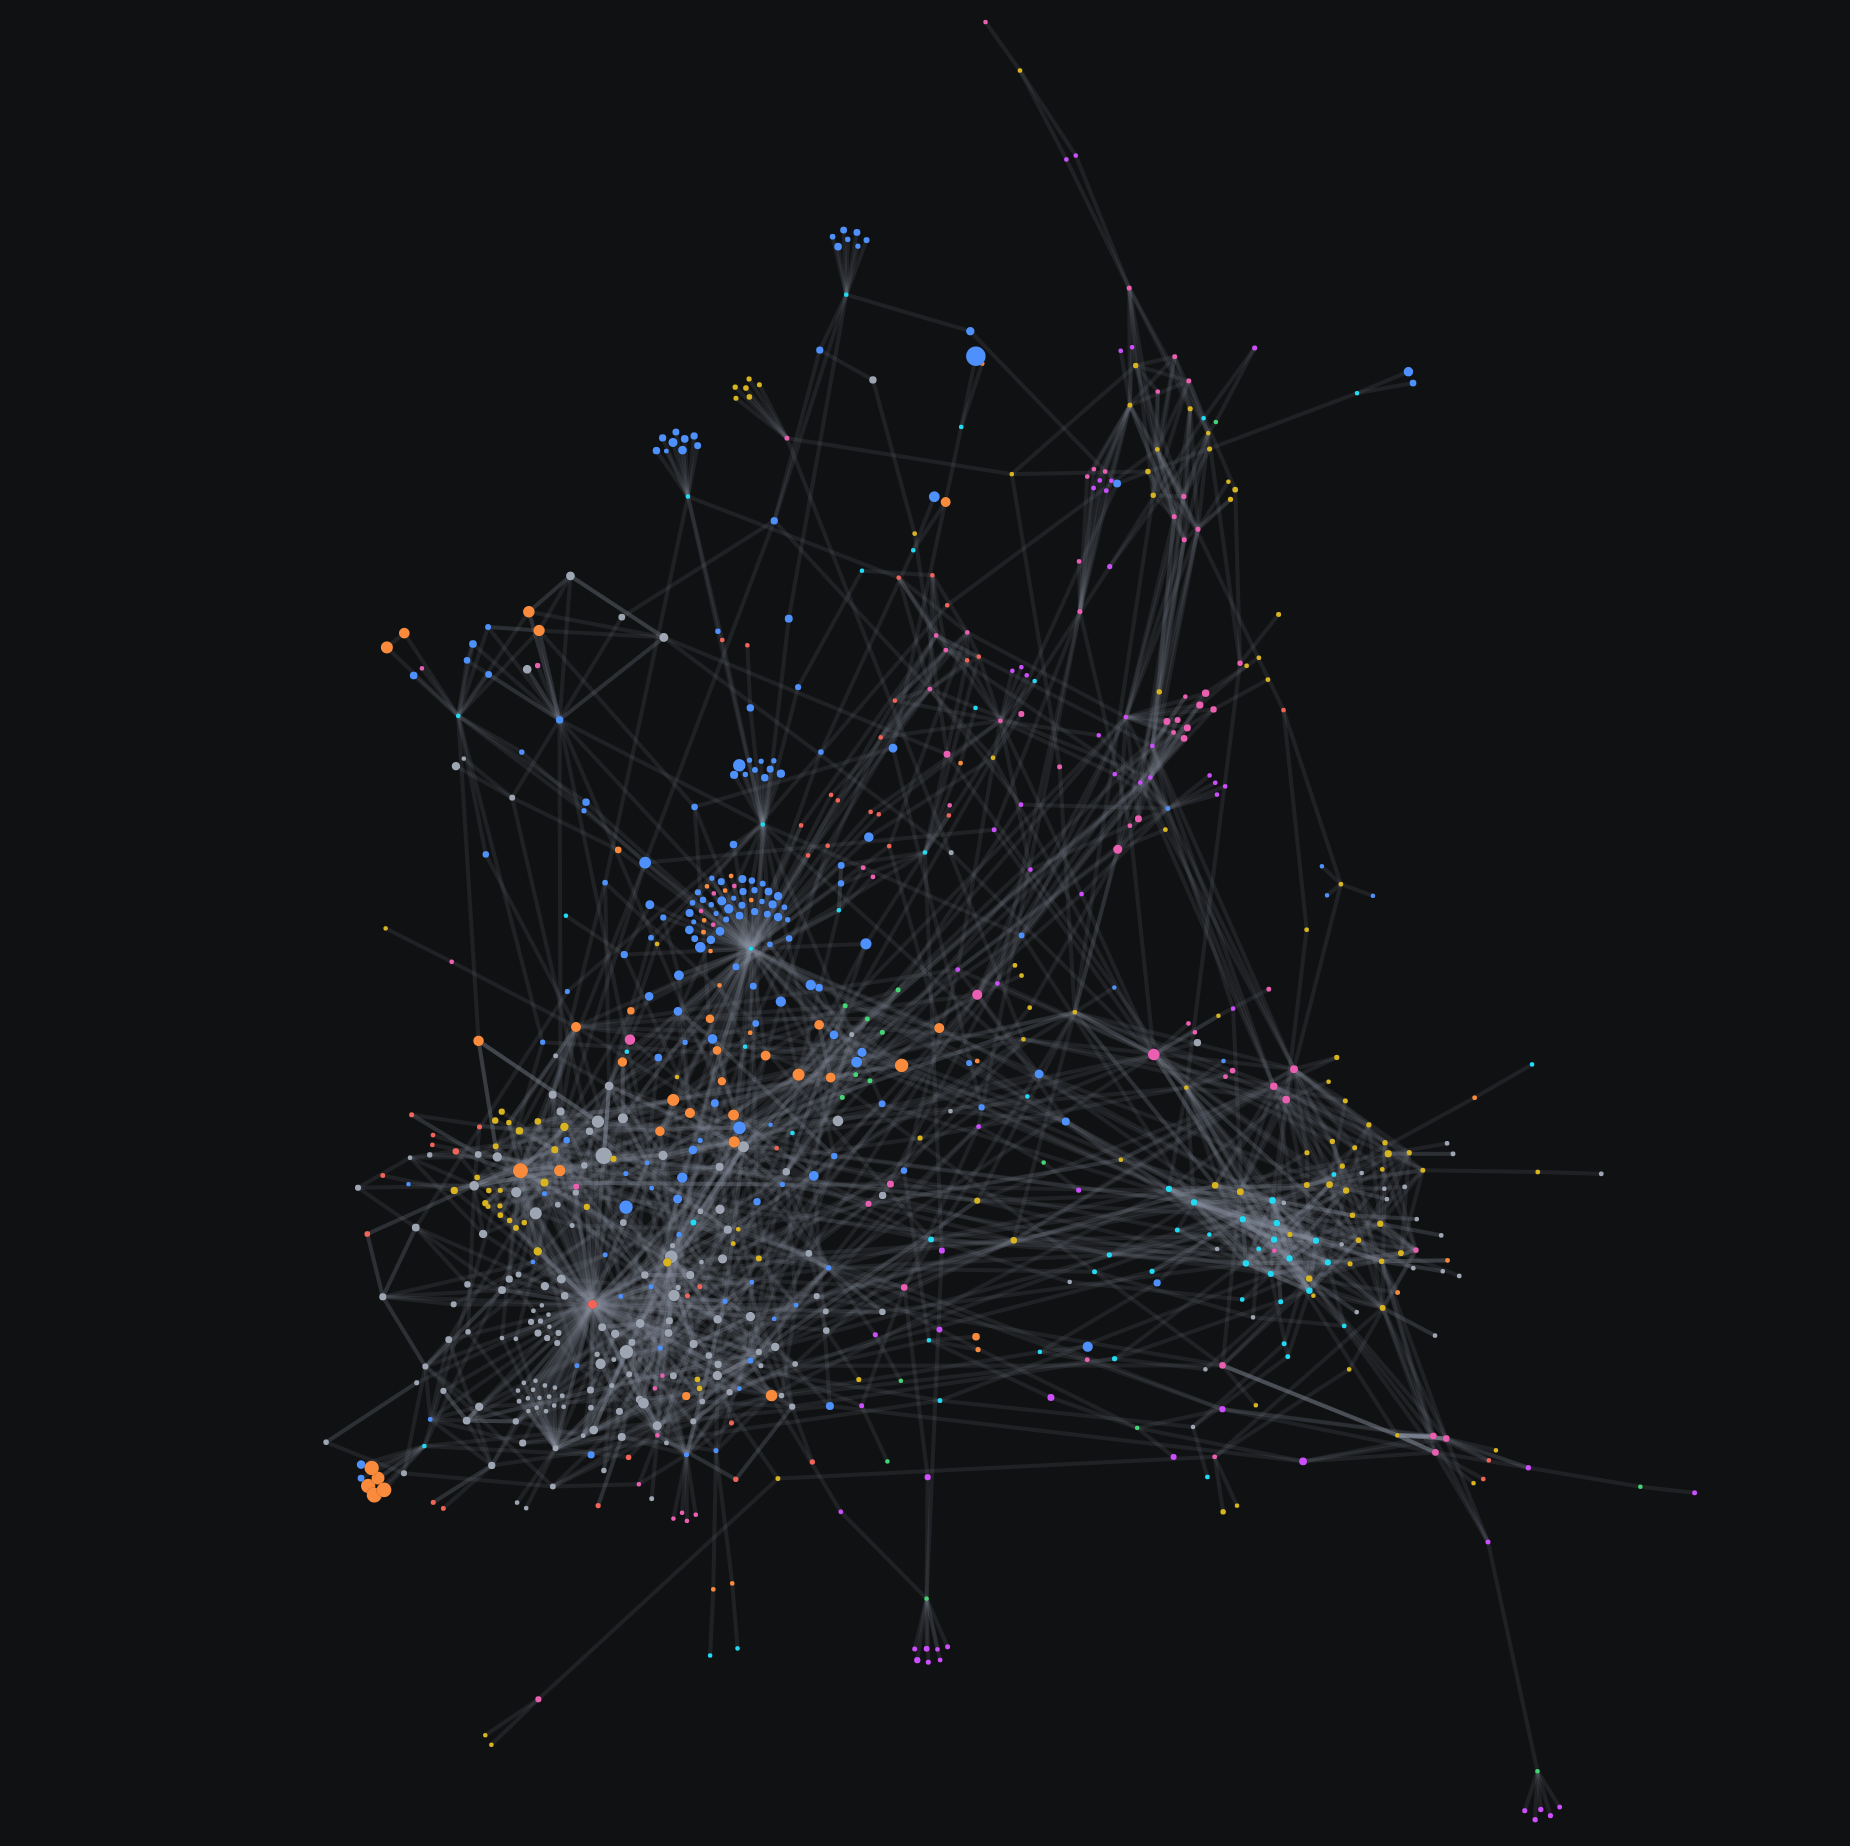
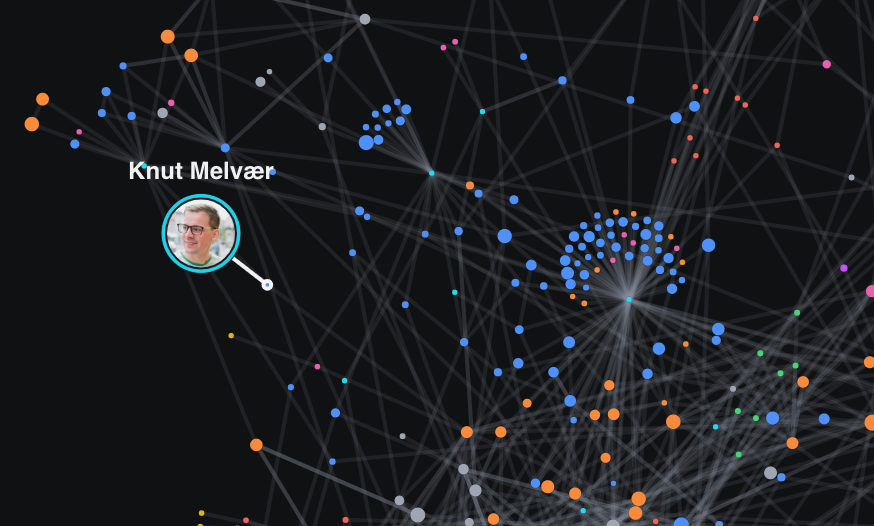
Graph View provides that perspective. It shows all documents in a dataset as nodes and the references running between them as vertices. For a larger dataset, like the sanity.io dataset, we could see a graph like this:
The graph is implemented using the browser's 2D canvas, with the help of a JavaScript library called react-force-graph.
When you open the view for the first time, it grabs a snapshot of the entire document set (this takes time with huge datasets, since everything has to be downloaded first), and then listens to changes. Whenever someone edits documents or adds references between them, the graph updates with new vertices and edges.
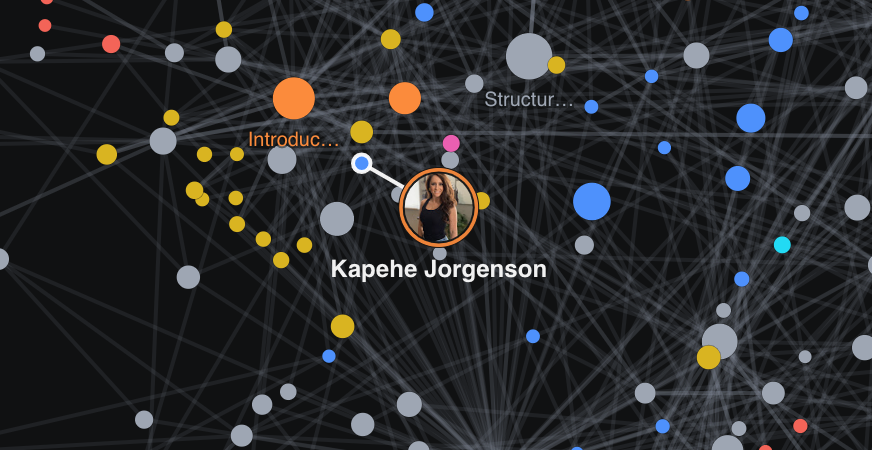
A hovering marker, or avatar, appears next to a document when it's edited, indicating who on your team is editing it right now. This avatar isn't yet displayed for logged-in users who are viewing the document, but this is something we want to add in the future.
The GitHub repo for this plugin can be found here.
If you want to watch a video of Bryan and Kap running through this new feature, you can check that out here:

How to add it to the Studio
The plugin can be added to your current Sanity Studio by running the following command:
sanity install graph-view

Once added, you will see {} Graph added to the top bar of the Studio. The full npm package can be found here.
Benefits of Graph View
This graph is real-time. When documents are added or updated, the connection will grow or change accordingly.
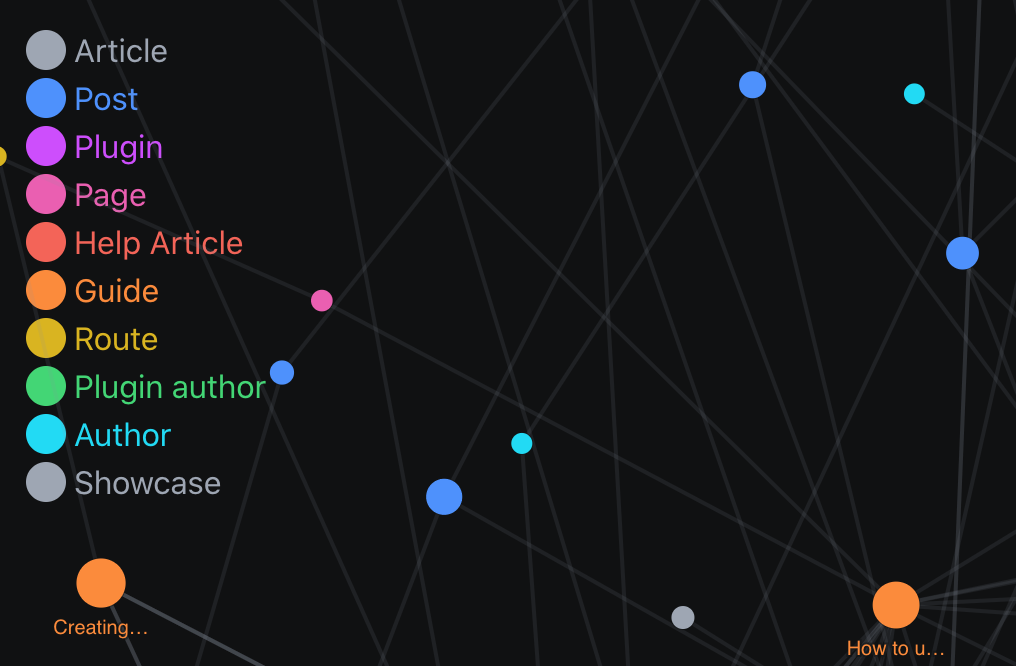
While using this graph, you will notice patterns emerging which can tell you a lot about your data:
- Islands of information - An island of dots may mean that data isn’t being used to its full potential and adding a connection could help.
- Connections between data - You could discover structures in the data that were never realized initially. This could open up ideas for other connections.
- Important points in the data - There may be one dot that a lot of other documents rely on heavily. You can use this information to prioritize updating and maintaining these documents.
Real-time
When someone is adding or editing data in the Studio, their avatar will show up and you will see exactly where they are in the Studio. The avatar moves as they move around the Studio. This is our collaborative Presence feature, shown in the graph view.
Available now
We are thrilled about this new plugin and are excited to see how beautiful your dataset graphs turn out. If you would like to share yours, post in the #i-made-this channel in the community where you can share your own instances of Graph View.
Run the command sanity install graph-view to get it up and running and check out just how interconnected your dataset is.