Published April 22, 2021
Real-time data visualization with React Charts and Sanity listeners

In this fast-paced world, even the smallest delay in communicating information from one end to another can be the difference between loss or gain of money, customers, or app traffic. The ability to communicate new information in real-time is fast becoming a de facto feature in every modern application. In this tutorial, you will learn and demonstrate the use of Sanity Listeners, a feature of Sanity that enables developers to build real-time functionality into their applications.
What are Sanity Listeners
Listeners are a part of the Sanity API that allows you to listen to content changes in your Sanity database in real-time. Sanity Listeners are built around the Server-Sent Events protocol thus they push updates to clients when data changes occur in the Sanity project. You can learn more about Sanity Listeners here.
Why use Sanity Listeners
If you're building applications like stock market visualization charts, document collaboration apps, or any application that requires users to get updates in real-time, then you need Sanity Listeners to help you listen to changes on your data and respond accordingly. They also save you from the complexity of implementing the WebSocket API or Server-Sent Events protocol from scratch.
What are we going to build?
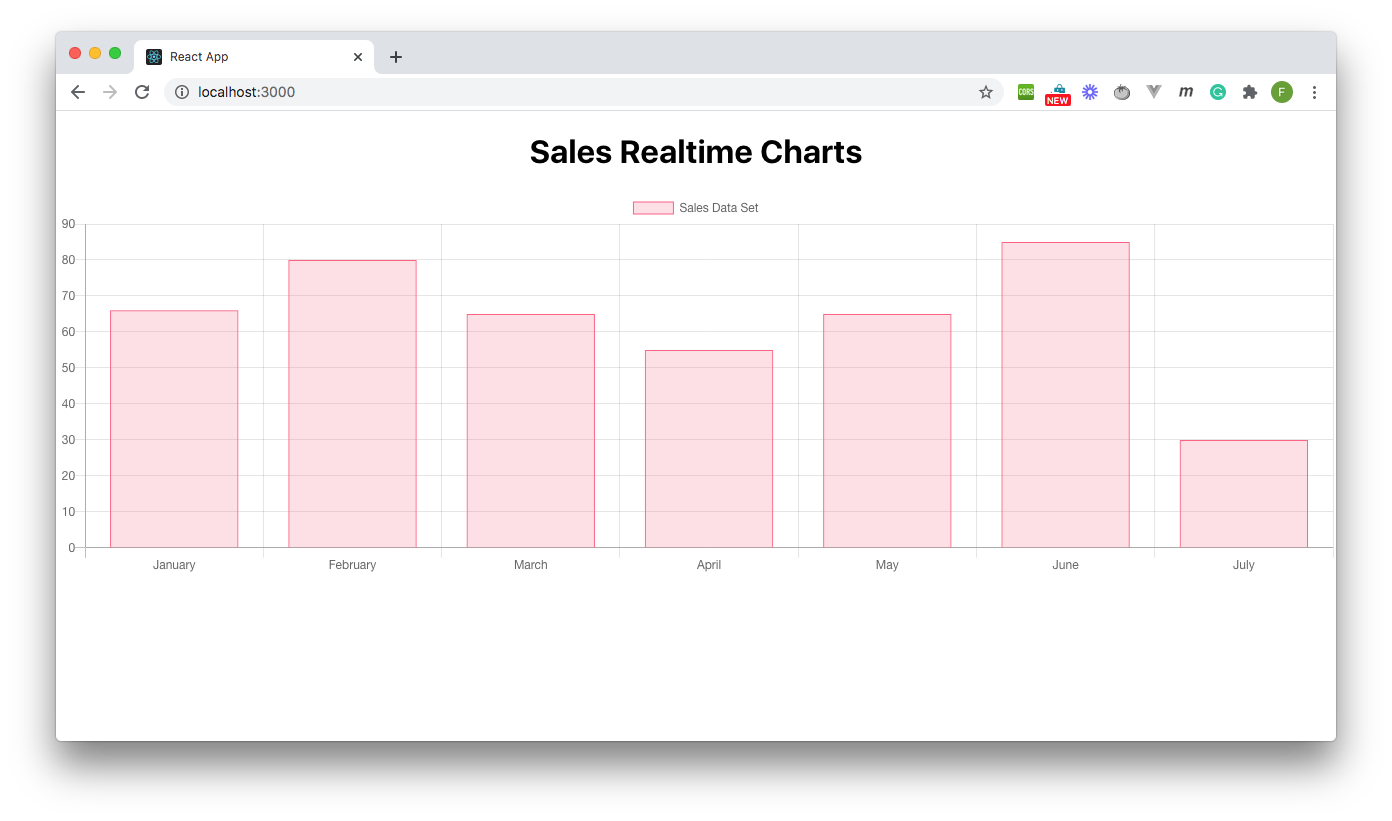
In this tutorial, we will build a simple data visualization chart using React with Sanity listeners. This chart will update in real-time using the power of listeners. Sanity will be used to hold data for this chart and the chart will get updated automatically as new data is fed in through Sanity studio. Shown below is a preview of the finished chart application:
Prerequisites
To follow along with this tutorial, there a couple of things you need to have set up:
- Node.js installed on your machine (version > = 10)
- Sanity CLI installed (find details on how to install the CLI here)
- Basic understanding of Javascript and Node.js
- Basic knowledge of React
Setting up the Chart Data
In this section, you will be setting up the database that will power the charts. The data will represent the monthly sales for a fictitious product. This will be a simple chart so all that will be needed is the month and the total sales for that month. You will build a schema for this using Sanity and populate some test data.
Creating the Sanity Project
To begin the chart project, you first need to create the folder for the project. This folder would contain the Sanity Studio application to manage the chart data and the react application that displays the chart.
Run the following commands to create the project folder and go into the root of the folder:
mkdir react-charts
cd react-charts
Next, create a new folder where the Sanity studio will reside by running the following command:
mkdir cms
cd cms
Now within the cms folder, run the following command to create a new Sanity project:
sanity initYou might be prompted to log in to your Sanity account through the browser if you have not already done this or the last login session has expired.
You will then be asked if you want to create a new project or use an existing one. Select "creating a new project" and the CLI tool will begin the project creation process by bringing up an interactive CLI that will prompt you for a few answers.
Below are the questions from the process and the replies you should provide for this demo. Italics are used to describe an action to perform
- Project name: charts-cms
- Use the default dataset configuration: Y
- Project output path: Hit the Enter key to select the default current directory
- Select project template: Clean project with no predefined schemas
This will then proceed to create the project and scaffold a new Sanity studio project inside the cms folder. You can now run the Studio by running the following command:
sanity startThis command will get the studio up and running, navigate to http://localhost:3333/ and you will see a schema-less dashboard as shown below:
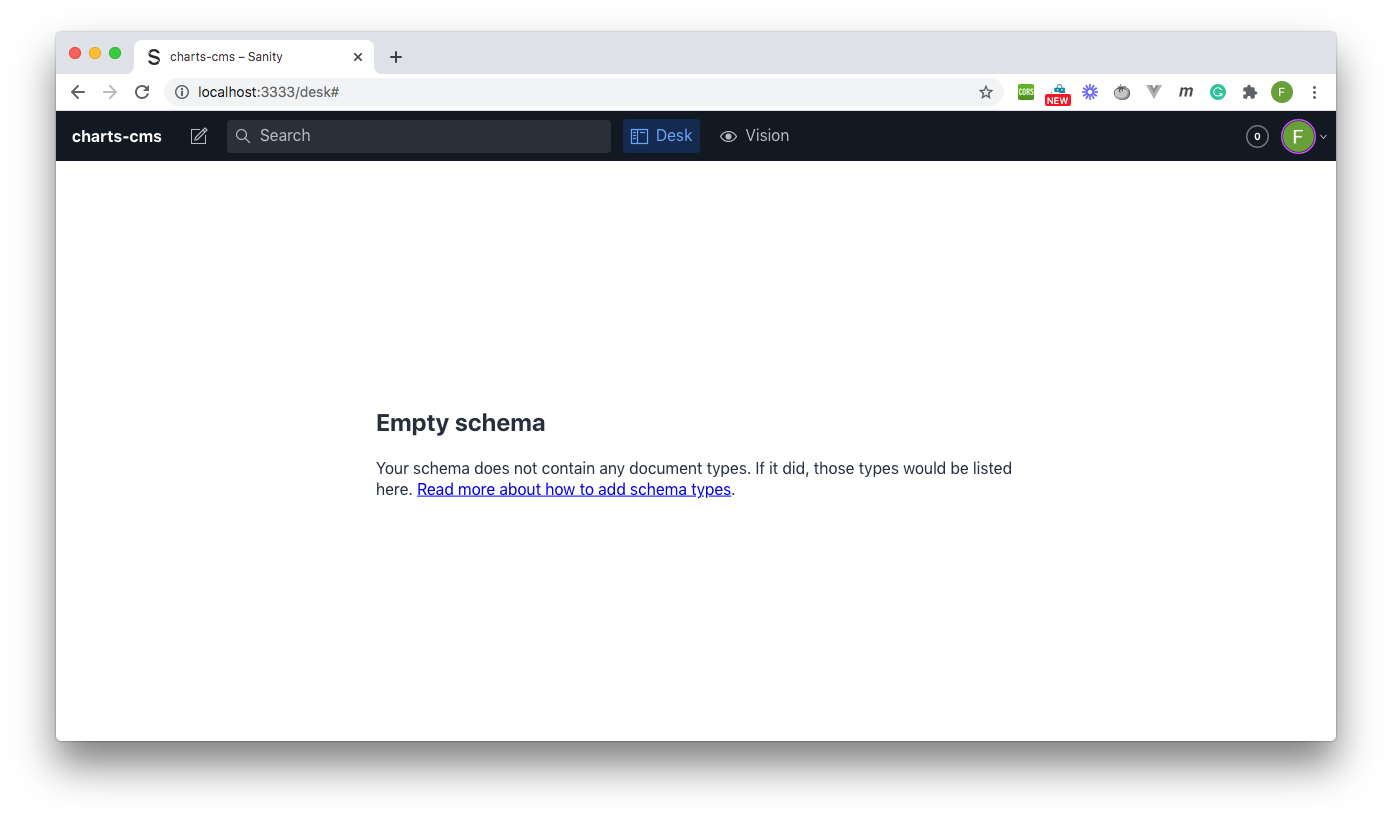
Note that you might be prompted to log into your Sanity account before the studio dashboard is shown.
Defining the Schema
Time to set up the data. You will be creating a schema for the total number of product sales for each month. Withing the code, locate the schemas folder inside cms, create the file salesrecords.js and enter the following code in the file:
// ./cms/schemas/salesrecords.js

export default {
    name: "salesrecords",
    title: "Sales Records",
    type : "document",
    fields : [
        {
            name: "month",
            title: "Month",
            type: "string"
        },
        {
            name: "totalsales",
            title: "Total Number of items sold",
            type: "number"
        }
    ]
}
In the code above, a salesrecords schema is created with two fields. The month field holds the name of the month of the year while the totalsales field holds the number of sales made for that month
To add this schema into the project, replace the content of schema.js inside the schemas folder with the following:
// ./cms/schemas/schema.js

import createSchema from 'part:@sanity/base/schema-creator'
import schemaTypes from 'all:part:@sanity/base/schema-type'

import salesrecords from "./salesrecords"

export default createSchema({
  name: 'default',
  types: schemaTypes.concat([
    salesrecords
  ]),
})
In this file, the salesrecords schema that was just created is imported and added to the schema types present in the project.
Entering Data
Now return to the browser where the Studio is opened up and refresh the page, you will now see the schema management tab. Click it and add data for the month of January as shown below:
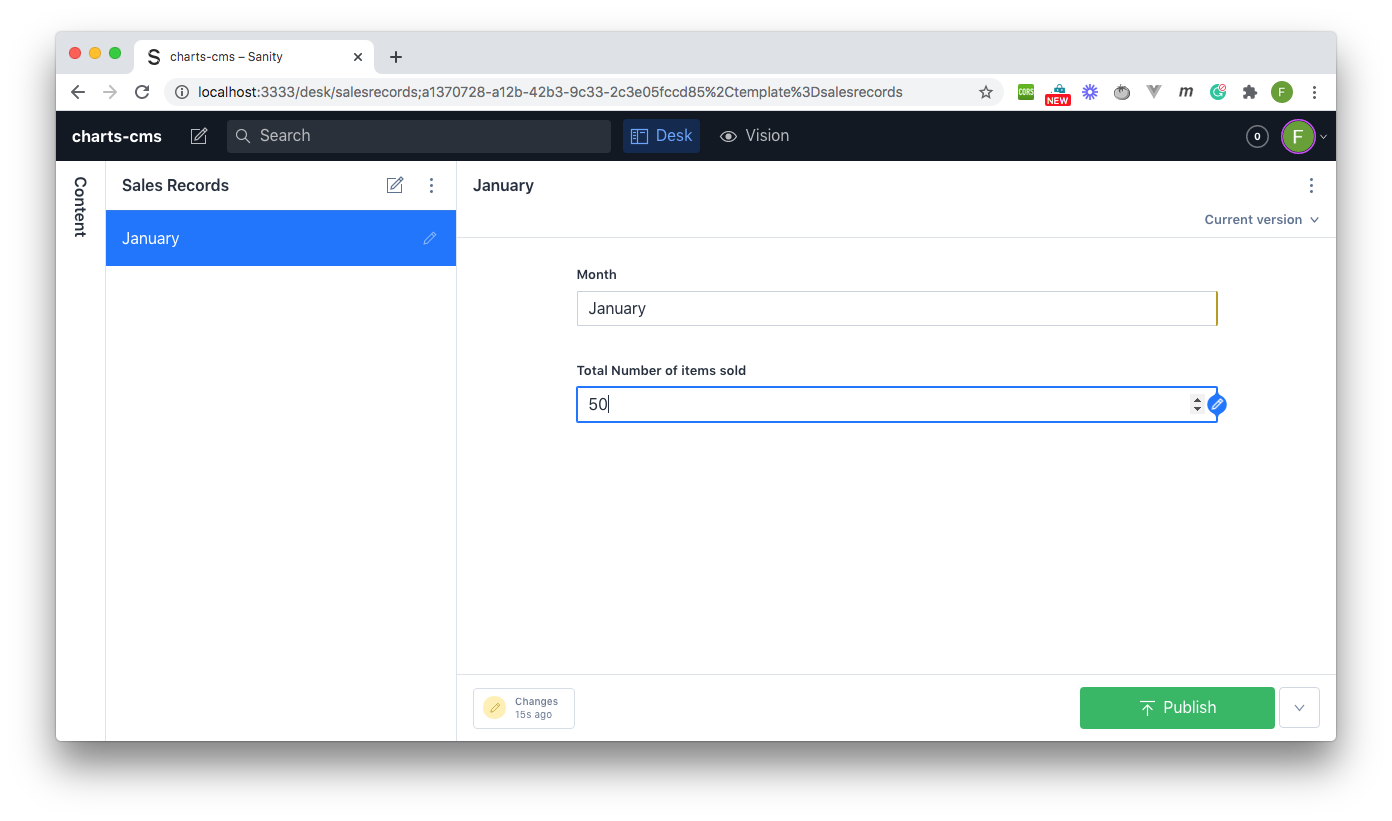
For the purpose of this demo, add data up to July so as to have enough test data to work with. Also, ensure that you're entering positive values only and preferably in increments of 10 and 5 for example 65, 45, 70, 85, etc., this will help create a chart that is easy to visualize the bar heights.
Creating the Chart Application
Now that the Sanity data server has been set up for this project, it's now time to build the client application. A React application will be created to visualize the sales data on a bar chart using Chartjs.
Before creating the React app, you need to get the "project id" for your Sanity project. Go to your Sanity dashboard like below:
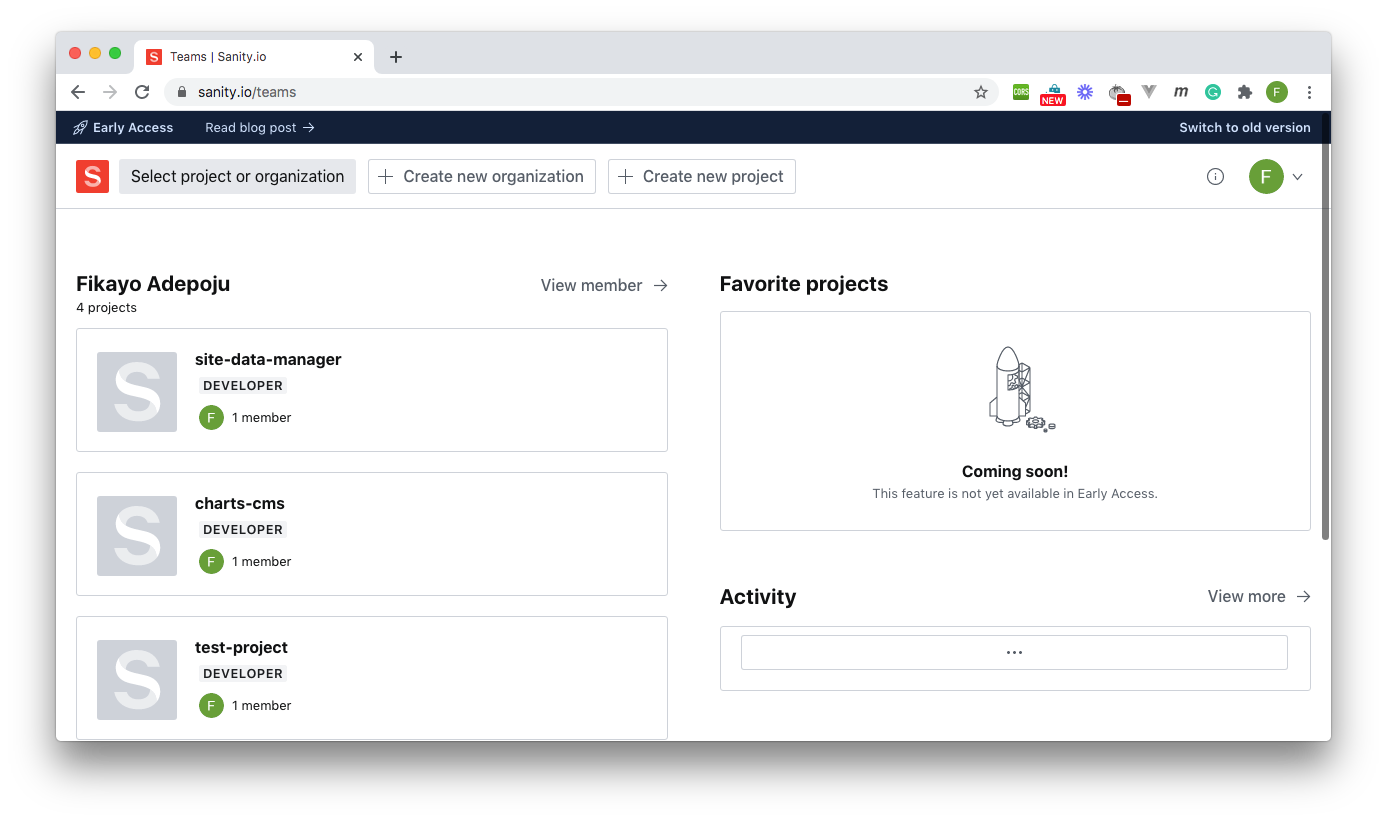
Click on the charts-cms project and you will see the "project id" on the details screen for the project.
Project Setup
To set up the React chart application, the first step is to scaffold a new React application using the create-react-app utility. Go out of the cms folder back into the main project folder (i.e react-charts) then run the following command to create a new React application:
npx create-react-app sales-chart
This will scaffold a new React application in the sales-chart folder.
Once this process is done, go into the root of the folder. To build the chart UI, connect to and receive updates from the server, the Sanity Client and react-chartjs-2 packages will need to be installed.
Install these by running the following command at the root of the folder:
npm install --save react-chartjs-2 chart.js @sanity/client
Once these are installed, you now have all you need to build the chart application.
Building the Chart Page
The React client application will need to make a connection to the Sanity server and listen for updates on the salesrecords schema. To achieve this, you will be creating a React hook to hold the logic for connecting to and listening to updates from the server.
Inside the src folder of the React app, create the file useSanityListener.js and add the following code:
// ./sales-chart/src/useSanityListener.js

import { useEffect, useState } from "react";

const useSanityListener = (client) => {
  const [salesRecords, setRecords] = useState([]);

  //Listen for data changes in Sanity
  const query = '*[_type == "salesrecords"]';
  const params = {};

  fetchRecords();

  useEffect(() => {

    const subscription = client
    .listen(query, params)
    .subscribe(newRecords => {
        console.log(JSON.stringify(newRecords.result, null, 4));

        let item = newRecords.result;

        let records = [...salesRecords, item];
        setRecords(records);

    })


    return () => {
        subscription.unsubscribe();
    };
  }, [client]);

  function fetchRecords(){
    client.fetch(query, params).then(records => {
        console.log(records);
        setRecords(records)

    })
  }


  return { salesRecords, setRecords };
};

export default useSanityListener;
In the file above, a useSanityListener method is then created and exported from the file.
This method takes in a Sanity project client and uses it to access the Sanity project.
A fetchRecords method that uses the query variables defined to fetch and set the records in the salesrecords schema is called to fetch records immediately the hook is initialized:
const query = '*[_type == "salesrecords"]';
const params = {};

fetchRecords();
Next, a useEffect hook is used to set up a subscription to the salesrecords schema using Sanity listeners by calling the listen method on the Sanity client and passing it the query to listen on and other parameters that might be required in the query (non for this demo). The subscribe method is then chained to the listen call and passed a callback that appends the newly created item to the records.
With this module in place, you can now build the chart UI. Locate src/App.js and replace the content with the code below:
// ./sales-chart/src/App.js

import {useEffect, useState} from "react"
import './App.css';
import useSanityListener from "./useSanityListener";
import { Bar } from 'react-chartjs-2';
const sanityClient = require('@sanity/client');


function App() {

  const client = sanityClient({
    projectId: "YOUR_PROJECT_ID",
    dataset: 'production',
    apiVersion: 'v2021-03-25',
    useCdn: false // `false` if you want to ensure fresh data
  })

  const { salesRecords } = useSanityListener(client);

  const [records, setSalesRecords] = useState([]);
  const [chartData, setChartData] = useState({});

  useEffect(() => {

    if(salesRecords && salesRecords.length > 0){
      console.log(salesRecords)
      let labels = ['January', 'February','March', 'April', 'May', 'June','July'];


      let salesData = labels.map(label=> {

        console.log(label);

        const monthData = salesRecords.filter(record => record.month === label);

        console.log(monthData);

        return monthData[0].totalsales
      })
      //let salesData = salesRecords.map(record => record.totalsales);

      console.log(labels);
      console.log(salesData)

      const data = {
        labels: labels,
        datasets: [
          {
            label: 'Sales Data Set',
            backgroundColor: 'rgba(255,99,132,0.2)',
            borderColor: 'rgba(255,99,132,1)',
            borderWidth: 1,
            hoverBackgroundColor: 'rgba(255,99,132,0.4)',
            hoverBorderColor: 'rgba(255,99,132,1)',
            data: salesData
          }
        ]
      }

      setChartData(data)

      setSalesRecords(salesRecords);
    }


  }, [salesRecords])


  return (
    <div className="App">
      <h1>Sales Realtime Charts</h1>
      <Bar
        data={chartData}

        options={{
          maintainAspectRatio: false,
          scales: {
            yAxes: [{
                ticks: {
                    beginAtZero: true
                }
            }]
          },
        }}
      />

    </div>
  );
}

export default App;
Breaking down the file above, the dependencies are imported including the useSanityListener hook and the Bar chart module from react-chartjs-2.
The Sanity SDK is used to create an instance of the Sanity client.
The dataset property is set to production which was the default dataset selected when creating the Sanity project in the previous section:
const client = sanityClient({
    projectId: "YOUR_PROJECT_ID",
    dataset: 'production',
    apiVersion: 'v2021-03-25',
    useCdn: false // `false` if you want to ensure fresh data
})
The useCdn property is set to false to ensure that fresh data is gotten always when a query is made.
Within the App function component, useSanityListener is passed the client created to fetch the salesRecords. A useEffect hook is then set up to watch for changes in the salesRecords in order to update the data setup for the Bar chart. For the purpose of this demo, only January to July is covered, each time salesRecords change, the Bar chart is updated in real-time.
Make sure you replace YOUR_PROJECT_ID with the project id from your project dashboard
Testing the Application
Now is the moment you have been waiting for, testing the chart application to watch it update in real-time. Ensure that the Sanity studio is running.
Now run the React chart application by running the following command at the root of the project folder:
npm startOnce the above command boots up the application, navigate to http://localhost:3000, this will display a chart similar to the one below, the length of each bar will be based on the values you entered into the Sanity Studio:
To test the real-time behavior of the application, open your Sanity Studio in another window (ensure that you have sanity start running within the cms folder) and update the sales number value for one of the months. You will see the bar for that month change size in real-time responding to the data change.
Wholla!
Conclusion
Applications like Google Docs, Figma, and Google maps all possess real-time capabilities that enable users to get updates as new data is received. These real-time features help achieve functionalities like document creation collaboration among different users, getting real-time updates and analytics on sensitive information like stocks and foreign exchange figures, and even multi-player internet gaming.
With Sanity Listeners, using knowledge from the exercise in this tutorial, you can build a better experience for your users like the ones mentioned above.
Happy Coding 😊
Sanity – The Content Operating System that ends your CMS nightmares
Sanity replaces rigid content systems with a developer-first operating system. Define schemas in TypeScript, customize the editor with React, and deliver content anywhere with GROQ. Your team ships in minutes while you focus on building features, not maintaining infrastructure.
Sanity scales from weekend projects to enterprise needs and is used by companies like Puma, AT&T, Burger King, Tata, and Figma.