Last updated August 15, 2026
Diagnosing API usage with charts and summaries instead of log files
By Nathan Nye

We’ve all been there. The client project blows through their CDN usage quota and you receive that panic-stricken meltdown of a Slack message. Attached is a screenshot of the dreaded “[ALERT] Project has used 100% of its included API CDN Requests” email. Your eyes roll back into your head as you gear up to sift through the gargantuan log file.
I built an npm library to skip that last step. Doing the work of highlighting overly-complex queries, heavy images, and traffic sources that are chewing up your quotas. 100% offline.
Using the library
A quick-and-dirty guide to getting a visualized output for your .ndjson or .ndjson.gz logfile.
Full docs can be found here
Installing
npm install sanity-log-analyzer
bun install sanity-log-analyzer
yarn add sanity-log-analyzer
pnpm add sanity-log-analyzer
Running the analysis
Run the following with your package manager of choice, I recommend putting your .ndjson or .ndjson.gz file at the root of the directory you run the command from so pathing is simpler, like below:
npx sanity-log-analyzer input.ndjson output.html --open
You’ll see the CLI start outputting while it’s runs. This usually takes less than a minute depending on the file size. The script parses data offline, nothing is not sent to external services.
⠴ Processed 1.2 GB / 1.2 GB (98.9%) — 1,264,879 entries
Wrote output.html in 6.6s (1,284,676 requests).
When finished, a static output.html will be generated (and opened in a browser via the —open flag).
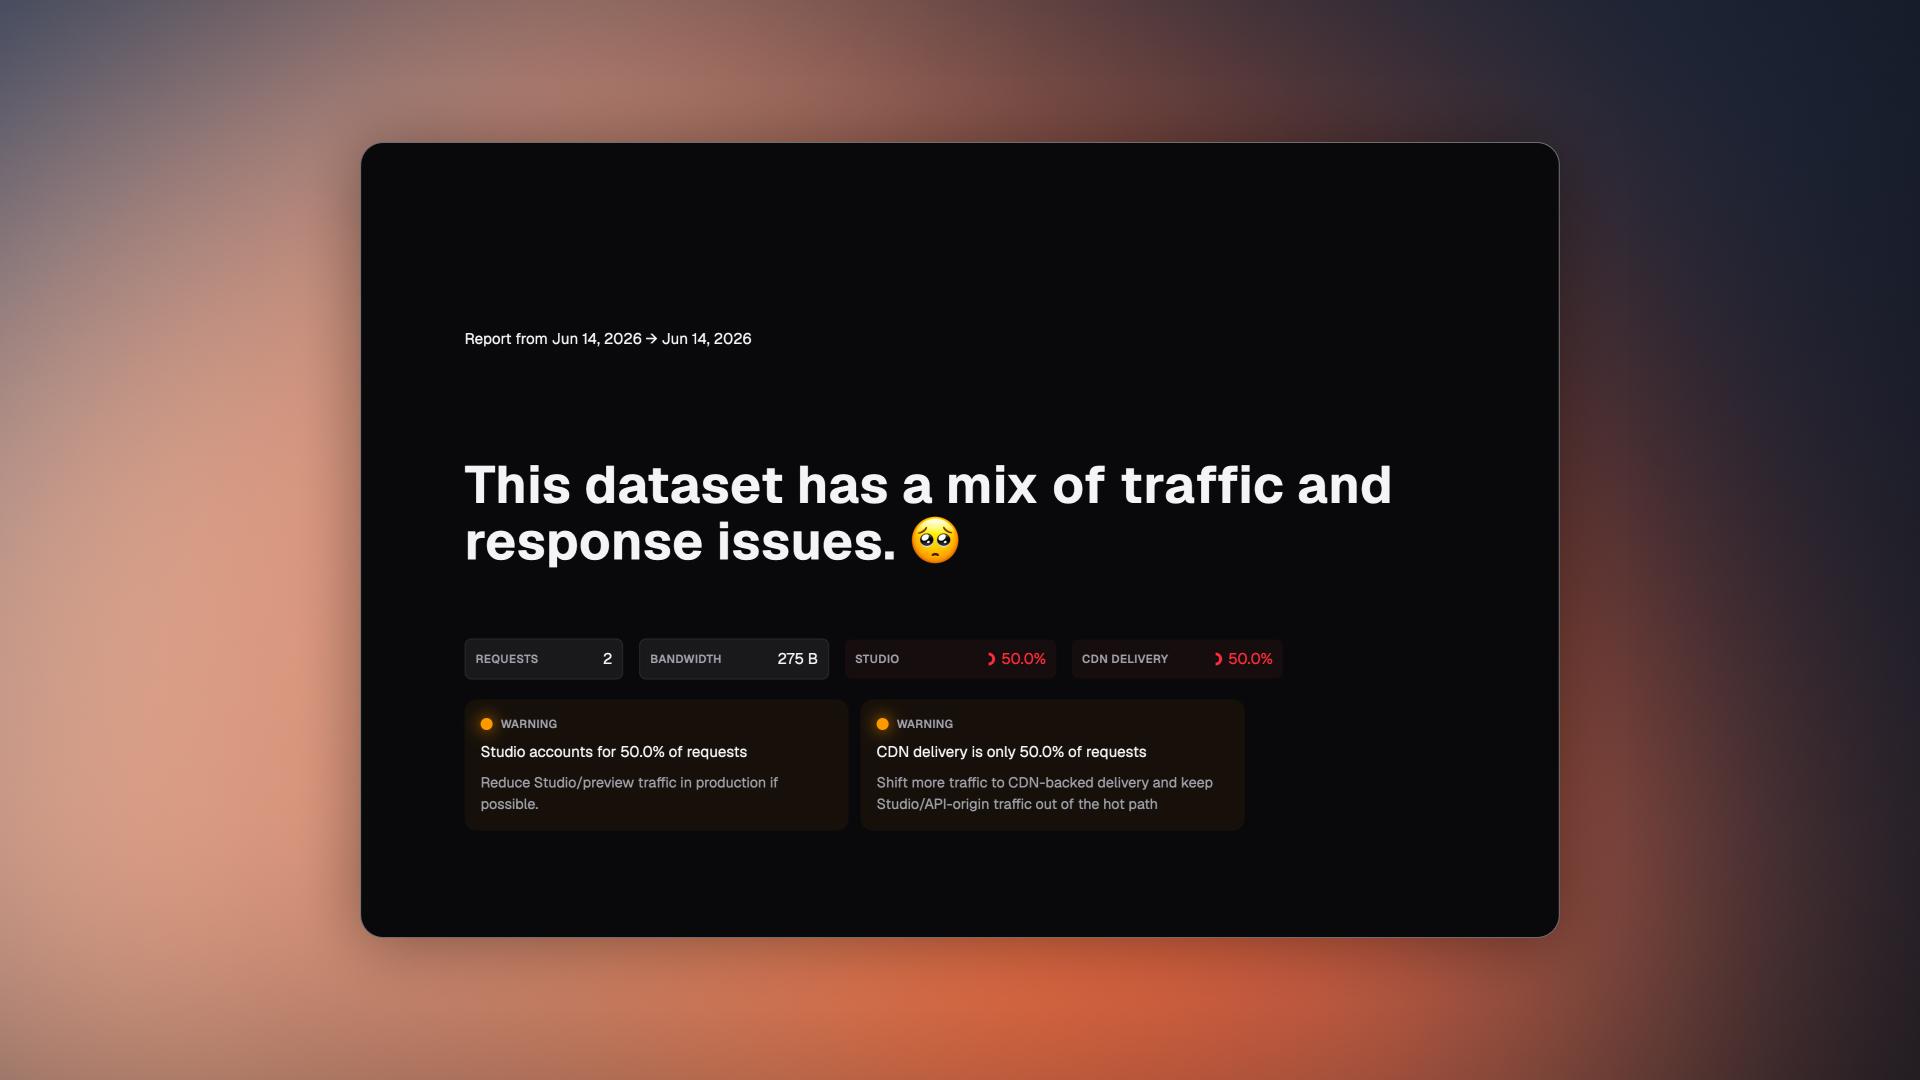
What to look for in the output
If you have a hunch what the issue might be, go ahead and dig through the output yourself. But if you’re a bit newer to the request log witch hunt, below are some pointers!
Queries
The library outputs a list of queries by average size:
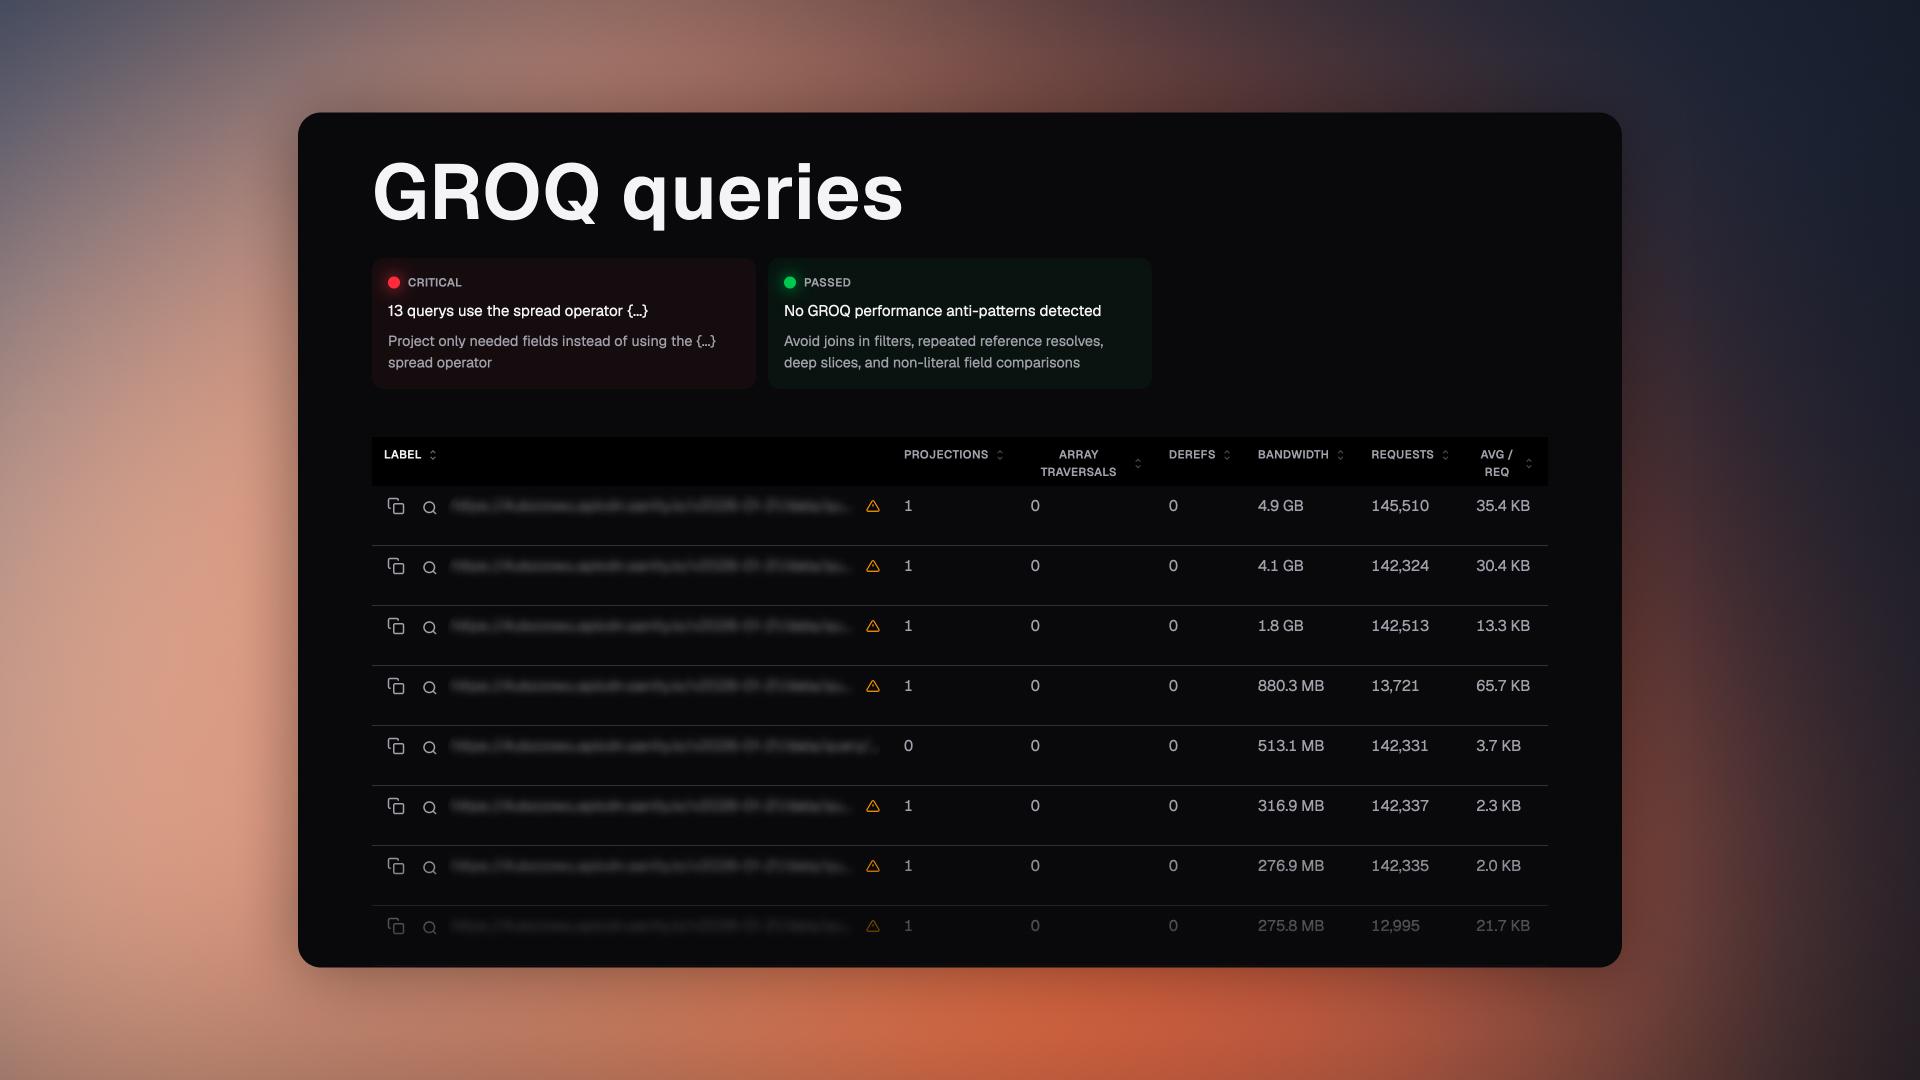
Also allowing you to break a query down into its pieces.
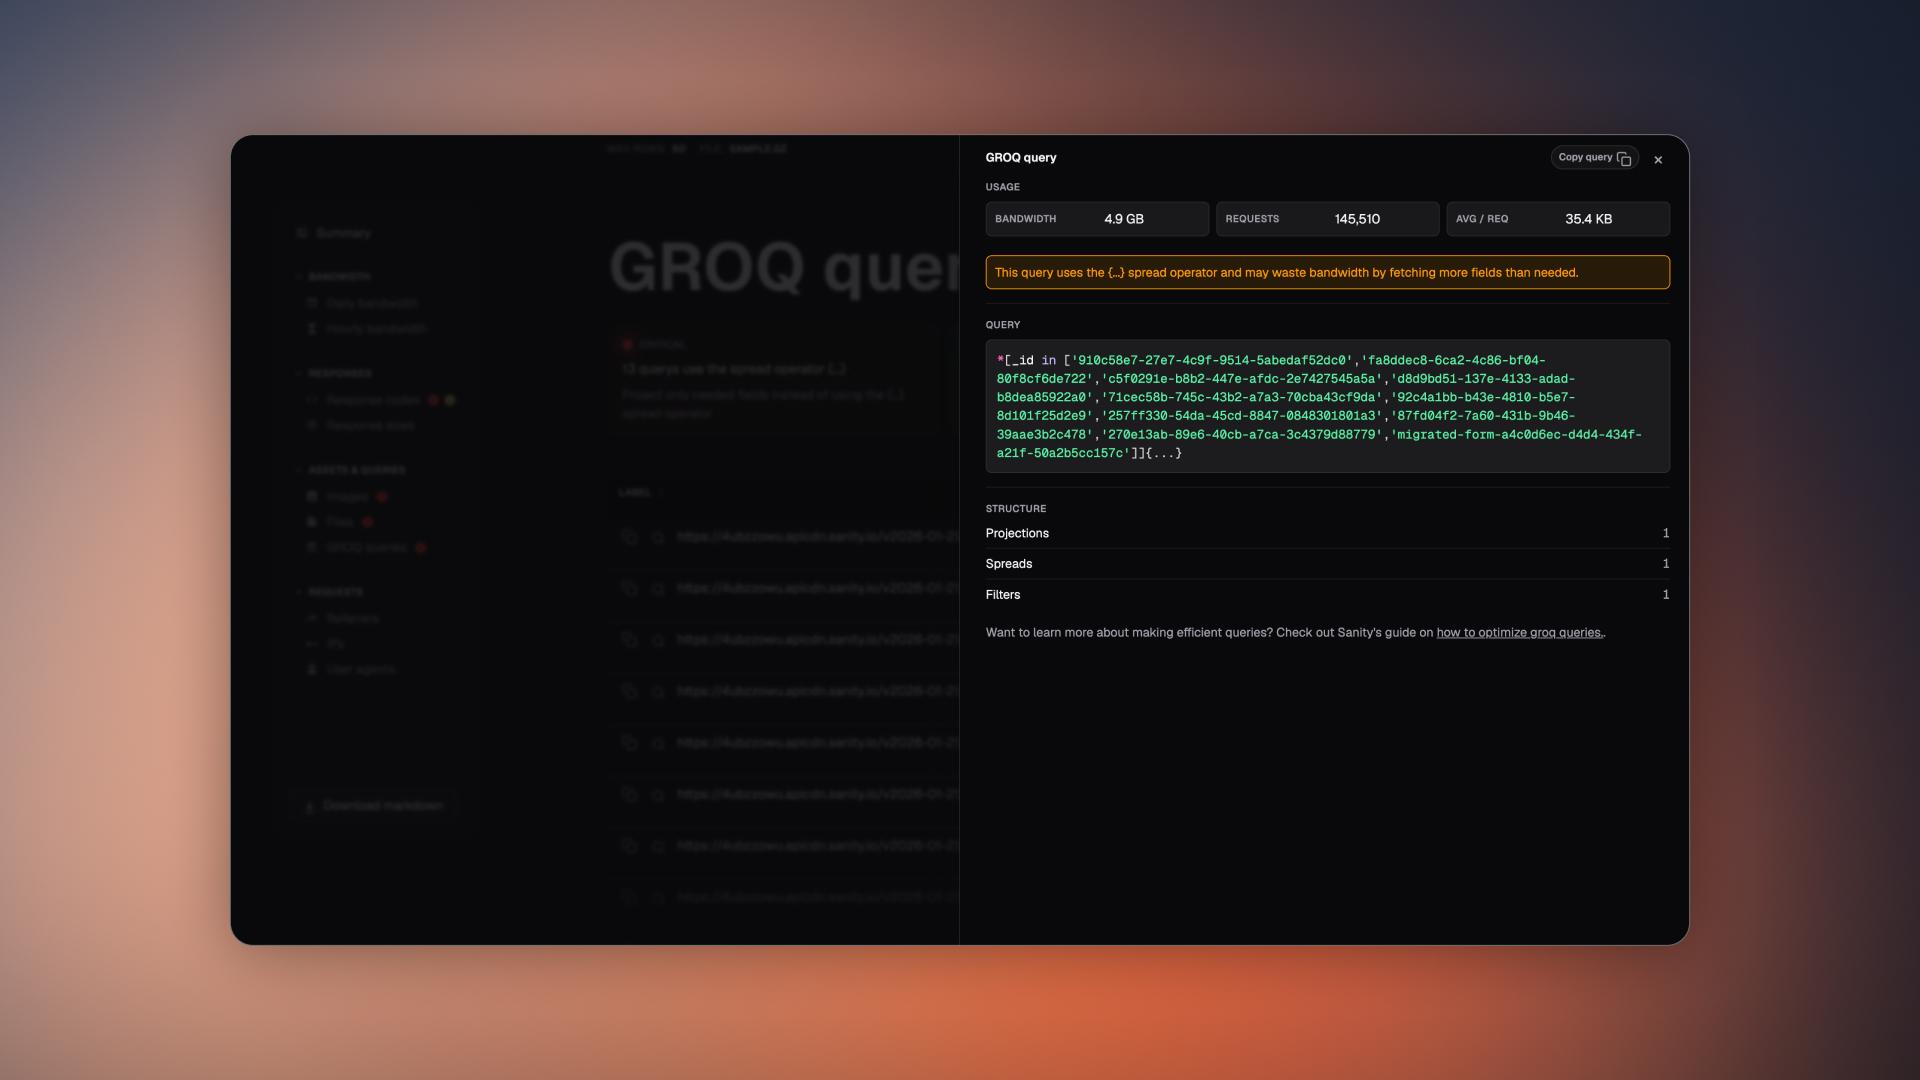
A few cases to watch for:
- If you are statically generating or using ISR: A query with a large payload size and high volume can indicate a page that isn’t generating statically. Refetching massive payloads on every request can rack up CDN volume extremely quickly.
- Large payload sizes in general can be suspect. Double check that the query needs to be as is. Can it be simpler?
- Spread operators. I know, they are easy, but the more specific a query, the better. Defining only the fields you need lets you rule out “this query pulls too much data” as a root cause.
Want to look more in depth at a query? Open up the flyout panel. It provides query mechanic breakdowns and the docs link to explain how queries can be made more efficient.
Media
How it looks in the generated output:
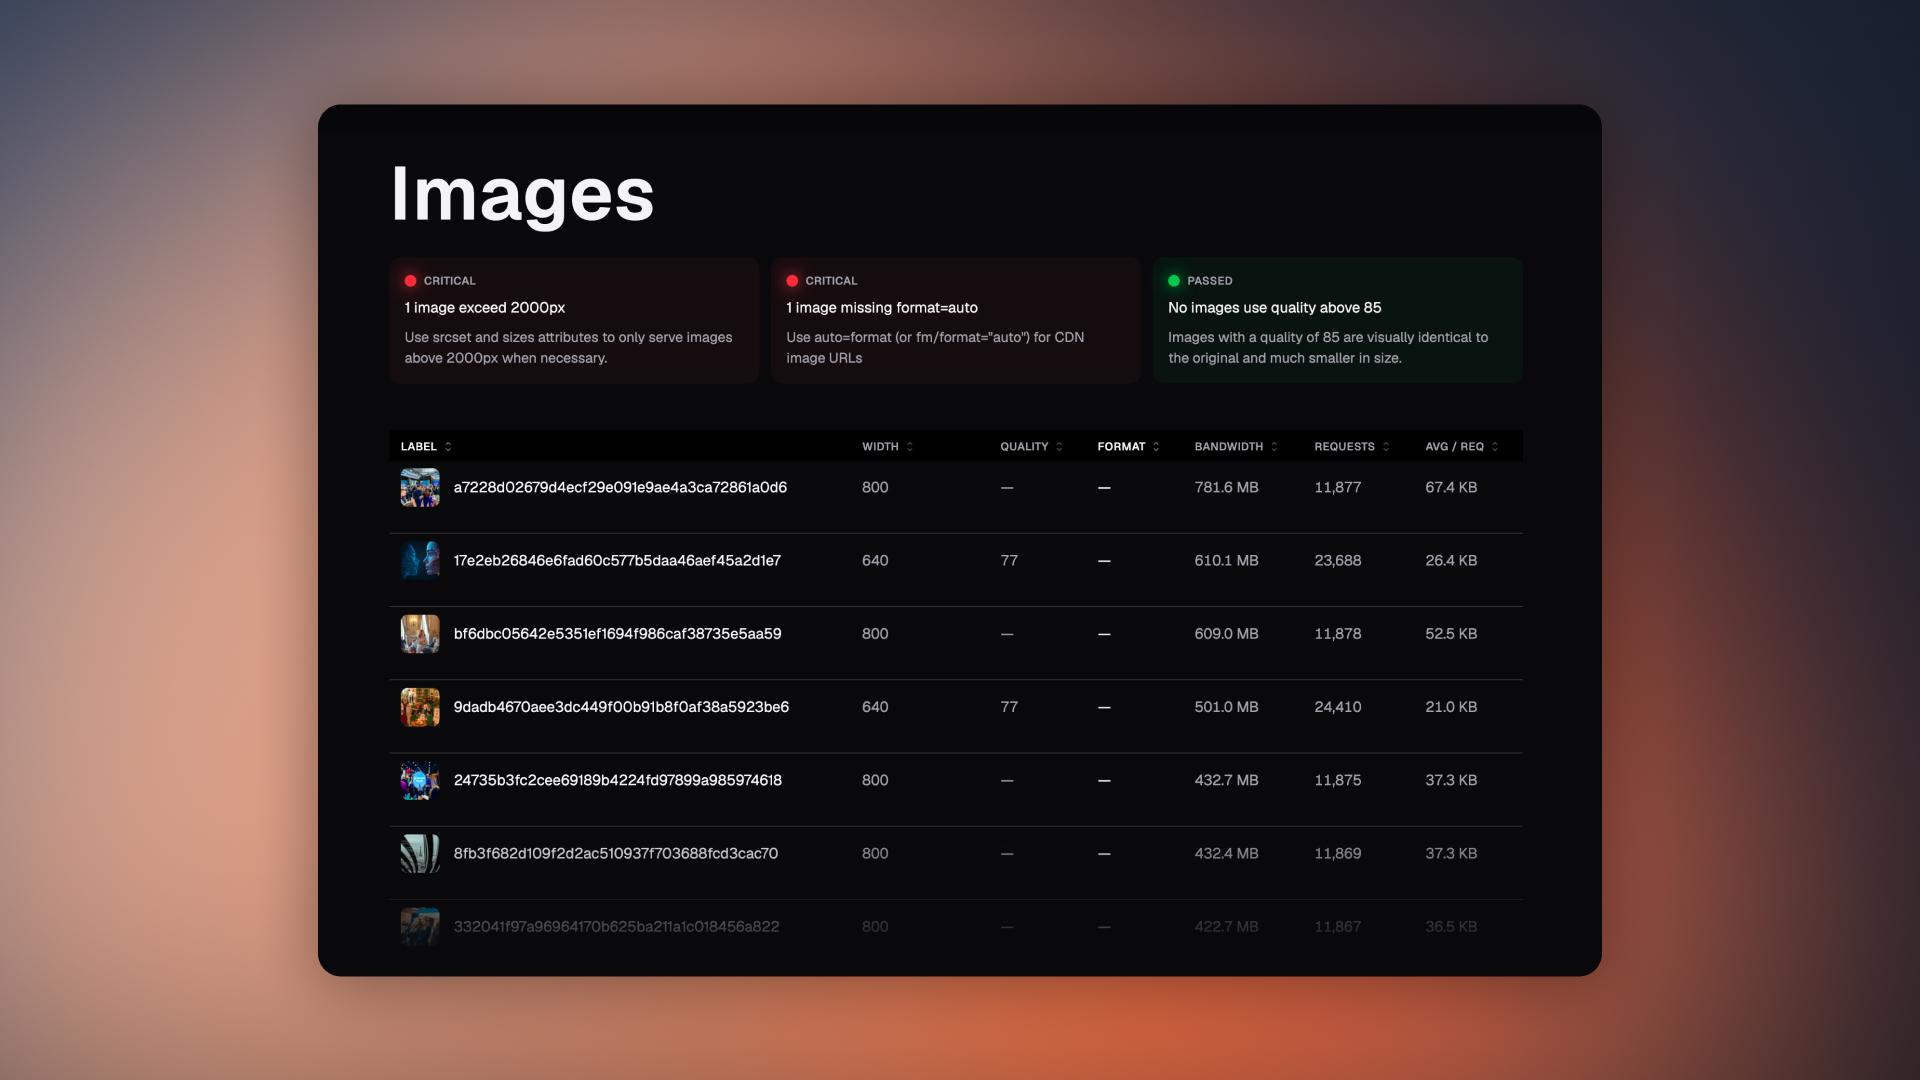
Serve images only as large as the user needs
srcset and sizes help define what sizes of images are served. Most screens are less than 1920px wide on desktop, and less than 414px wide on mobile (statcounter). If your output stats are dominated by images over 2000px wide, this can mean you have images without srcset or sizes that limit the size of images to a user’s screen size.
Use efficient formats
Browser support for webp and avif is fantastic these days (2026). But if you’re a bit gunshy to use the latest and greatest, make sure you are using the auto format for images, so it can serve the user only what is supported by their browser. png and jpg are massive by comparison. Newer formats like avif and webp can cut the size of any given image by over 50%.
Please don’t use MP4s :)
As a rule, MP4s on a website are sub-optimal; huge in size and fully downloaded every time a browser needs them. There are two solves:
- Lazy-load videos, only loading them when in the viewport (make sure to set a poster image or these will flash when they load)
- Use a service like Mux, Bunny, or Cloudflare Stream that take advantage of HLS and MPEG-DASH, formats which serve small snippets instead of giant singular files. (The same technology as Netflix uses to play back high-resolution movies quickly on your laptop).
Traffic panels
IP addresses, User Agents, Referrers and time-based bandwidth charts are also baked in:
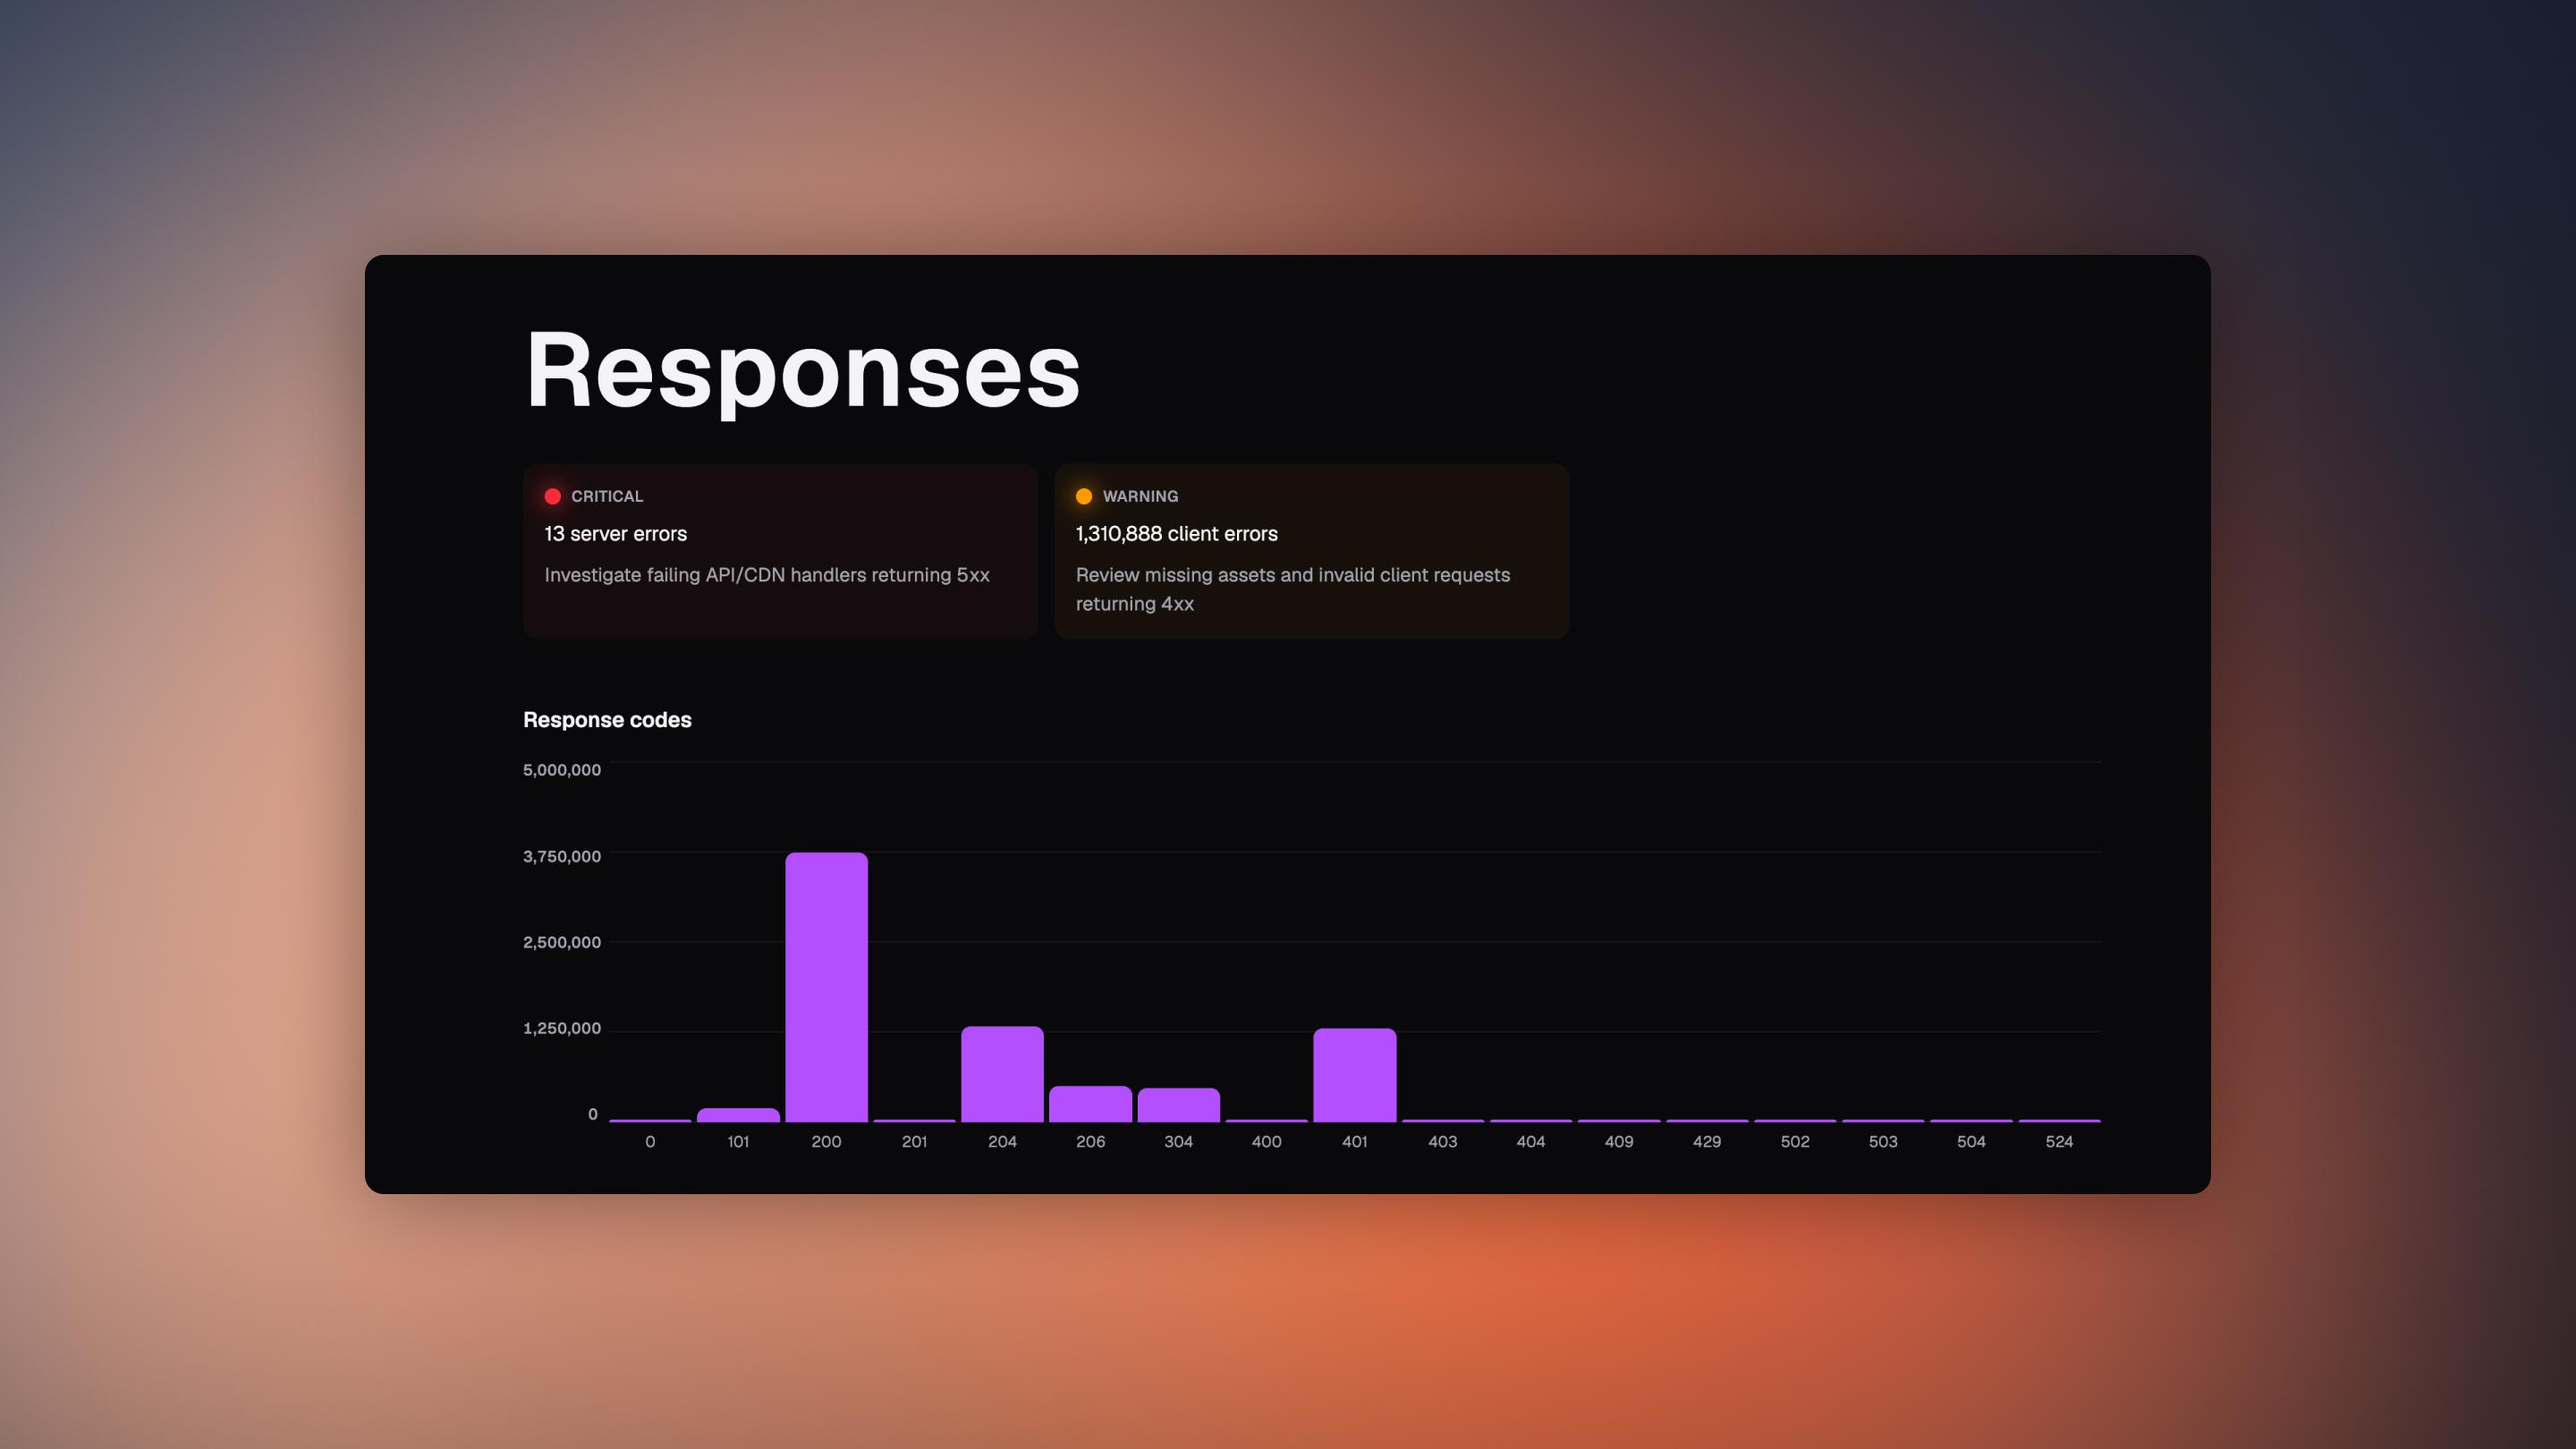
These are less for diagnosing quota usage and more so for finding unexpected inefficiencies like high error rates. Helpful for finding spikes in 4xx and 5xx across requests.
Conclusion
Hopefully this saves you the eye-roll next time a project hits its usage cap unexpectedly :)
Want to make this better?
This project is open-sourced on GitHub. Have ideas for ways this library can be more helpful, spin up a discussion or PR!
Sanity – The Content Operating System that ends your CMS nightmares
Sanity replaces rigid content systems with a developer-first operating system. Define schemas in TypeScript, customize the editor with React, and deliver content anywhere with GROQ. Your team ships in minutes while you focus on building features, not maintaining infrastructure.
Sanity scales from weekend projects to enterprise needs and is used by companies like Puma, AT&T, Burger King, Tata, and Figma.